The first thing to remember is that there is a time lag – usually 3 to 6+ weeks – between a new listing coming on market, an offer being negotiated and accepted, and when the transaction actually closes sale. This means that almost all of the sales price data we have, as of the first week of April, still reflects the market BEFORE the shelter-in-place rules went into effect. In virtually all Bay Area counties, March median sales prices were quite strong.
This report will look at the effect of the crisis on supply and demand by reviewing week by week statistics, sales price trends reflecting the market before the crisis, and longer-term trend data to give context to how the market typically performs at this time of year. Spring is usually the most active selling season and often sees the highest median sales prices of the calendar year, due to both the level of buyer demand and the seasonal surge in the luxury home market. (A higher percentage of luxury home sales pulls up the overall median sales price.)
We do not know how the crisis will ultimately play out, depending as it does on so many, rapidly changing, socio-economic factors.
Median Sales Price Trends
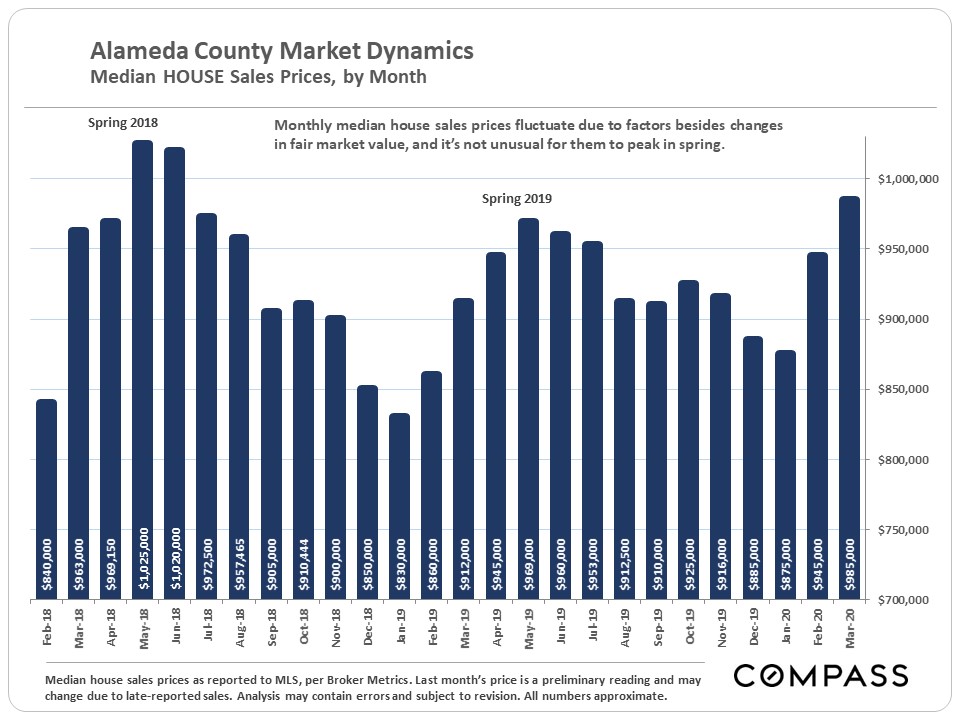
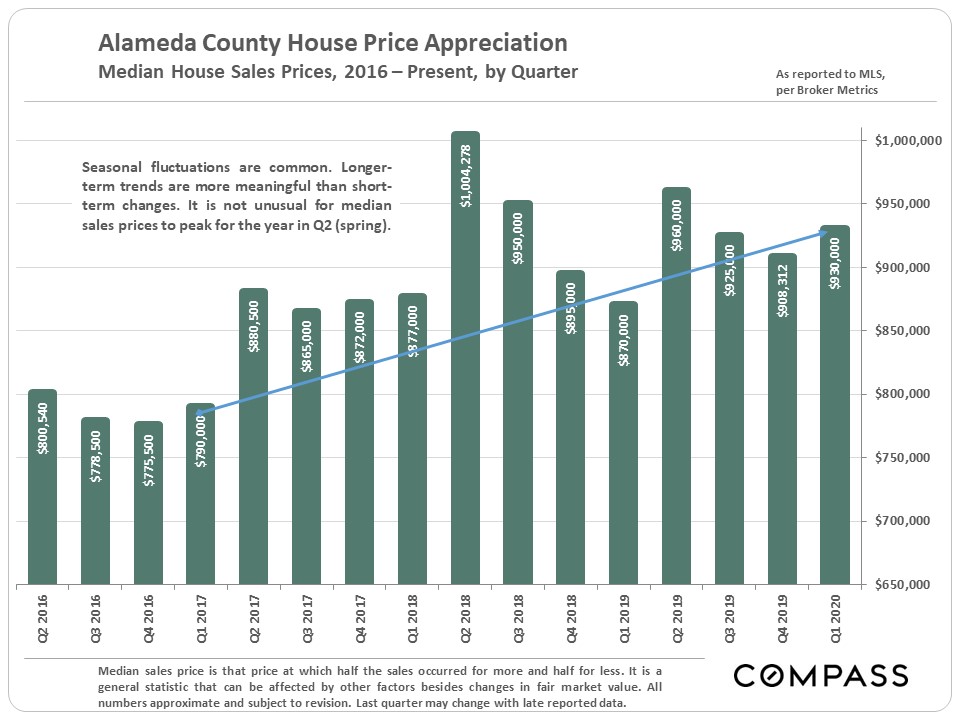
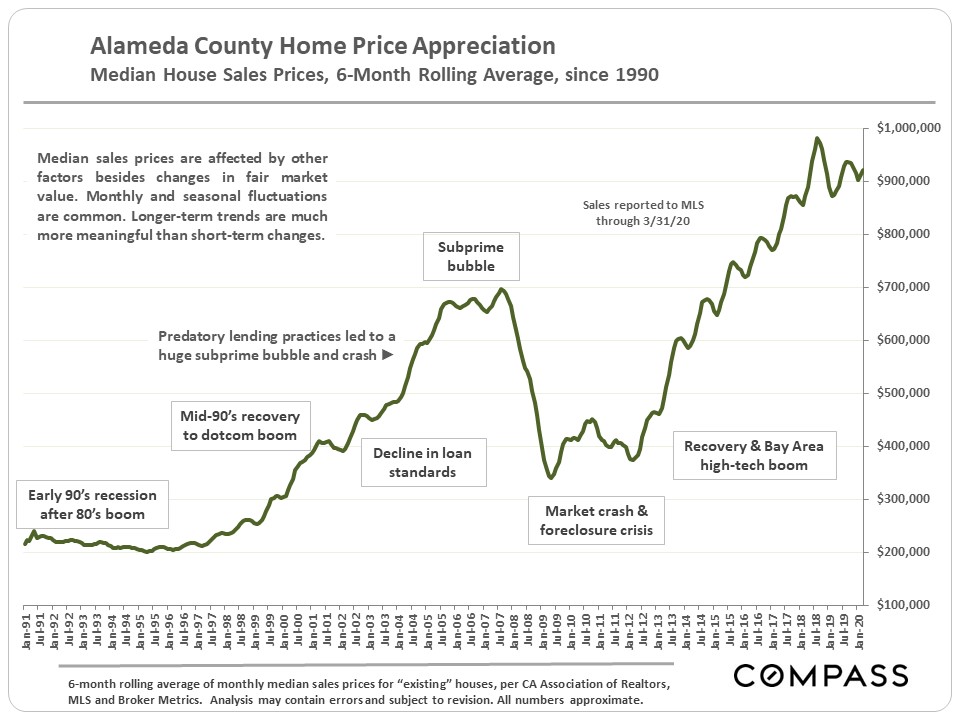
These first 3 charts review median sales price trends in the short, medium and long-term. March and first quarter prices generally reflect the pre-crisis market. Link to our Bay Area home price map
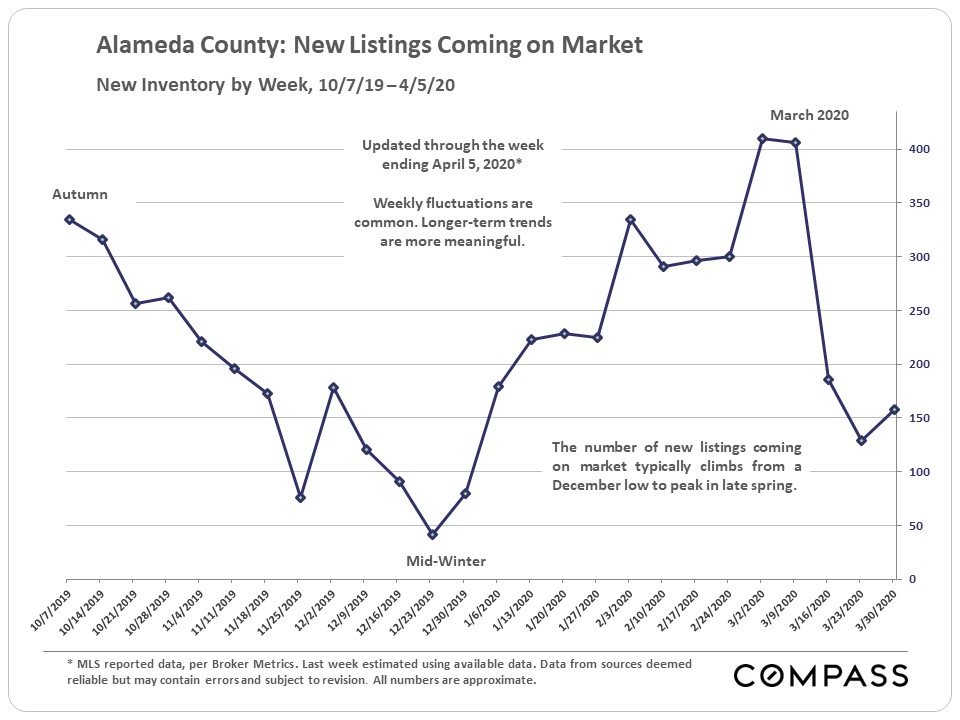
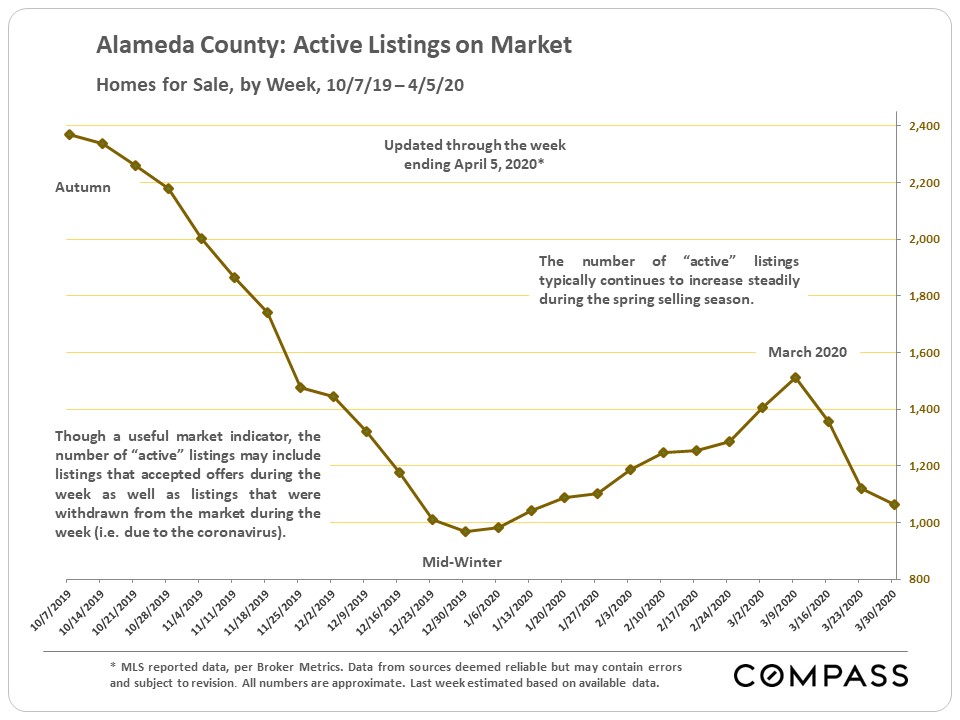
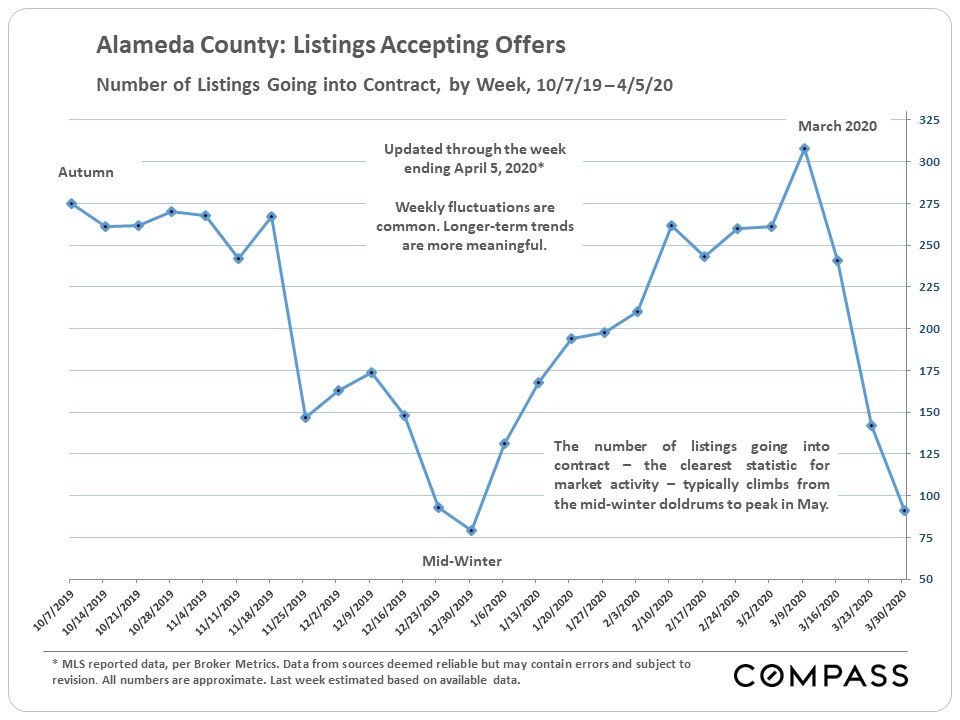
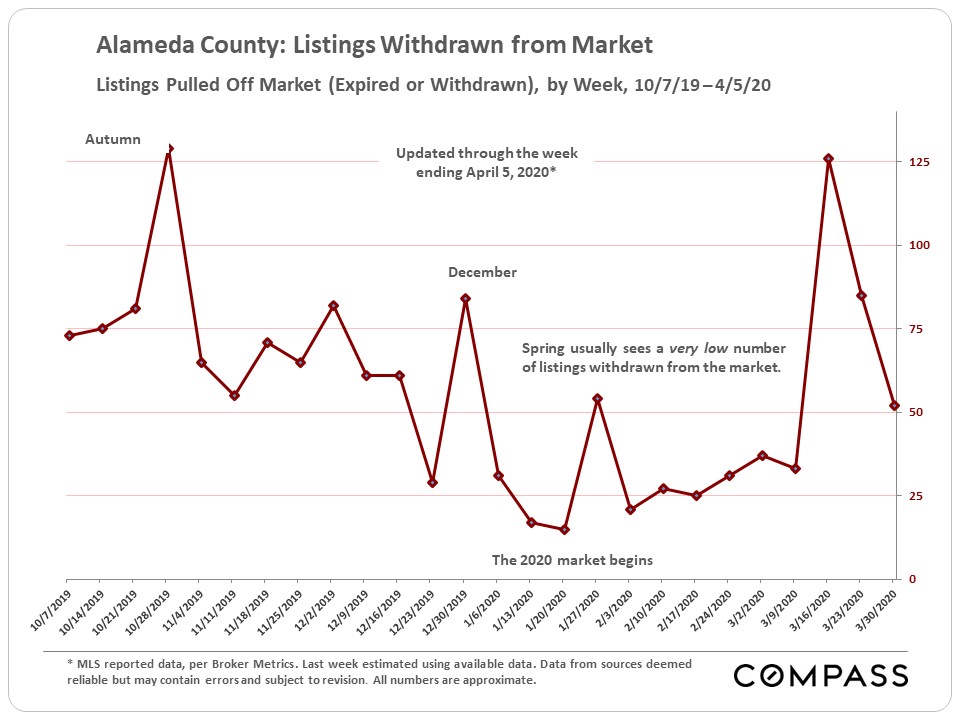
Shelter-in-Place Effect on Inventory & Deals – by Week
The following 4 charts detail the plunge in listing and accepted-offer activity, and the surge in listings being pulled off the market by sellers, over the past 4 weeks. Typically, at this time of year, the first 3 charts would be seeing steady climbs over February numbers, and the 4th chart would have a very low, flat trend line. Though the numbers are way down, some listings have still been going into contract.
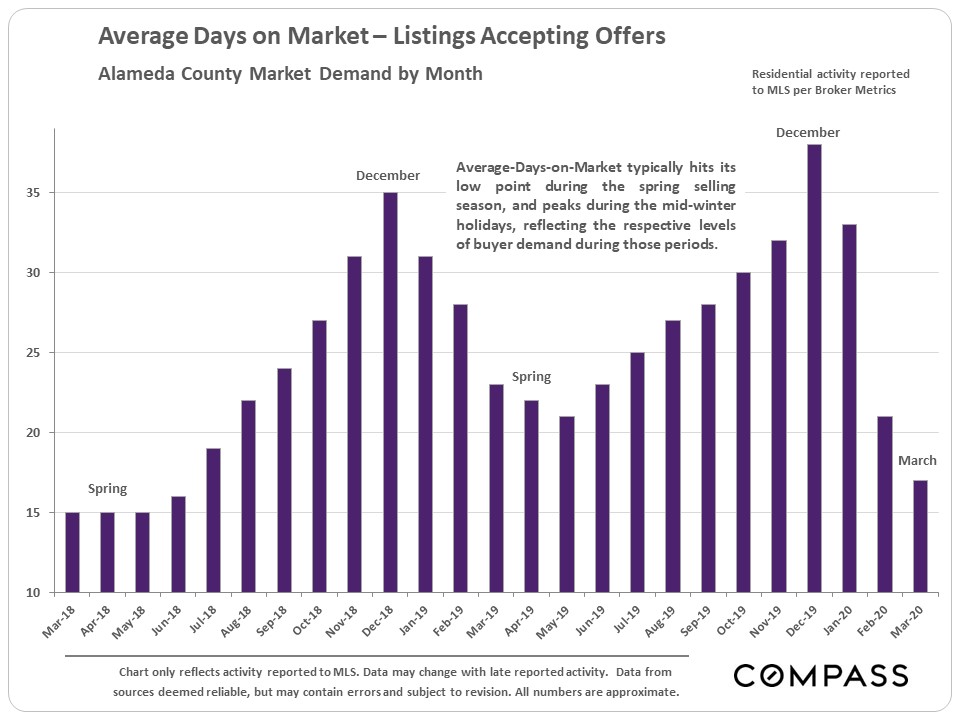
Average Days on Market by Month
Those listings that did go into contract in March – a much lower number than normal – apparently did so quite quickly after coming on market, presumably seizing the attention of buyers despite the crisis. Or the buyers and sellers may already have been in the midst of negotiations when shelter in place rules began.
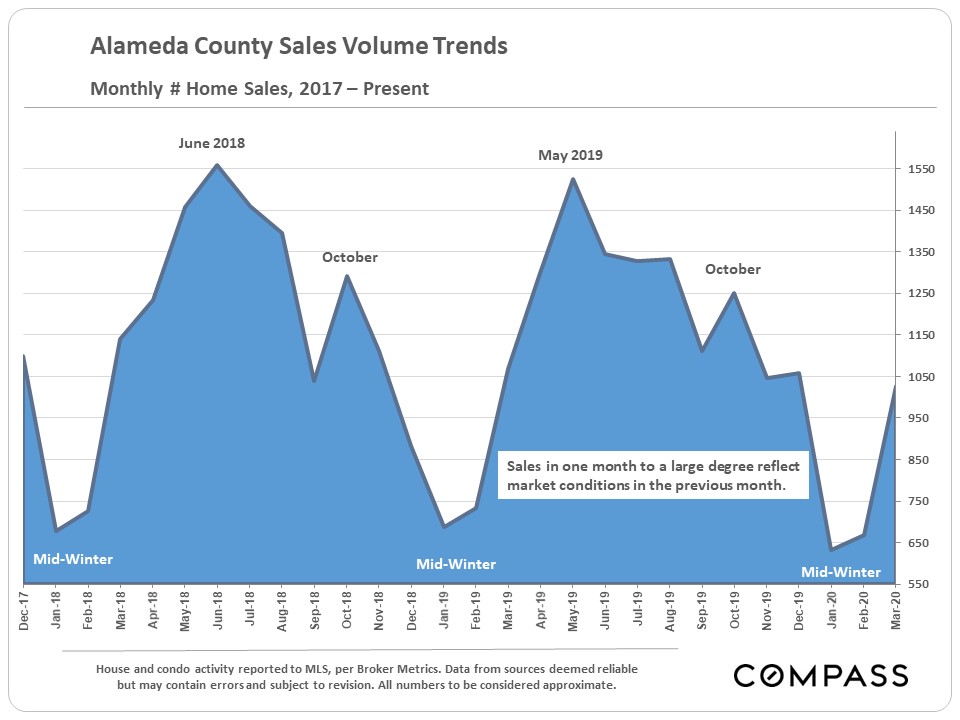
Seasonal Trend in Sales Volumes by Month
This chart illustrates how seasonality typically affects sales, climbing rapidly from the beginning of the year through late spring.
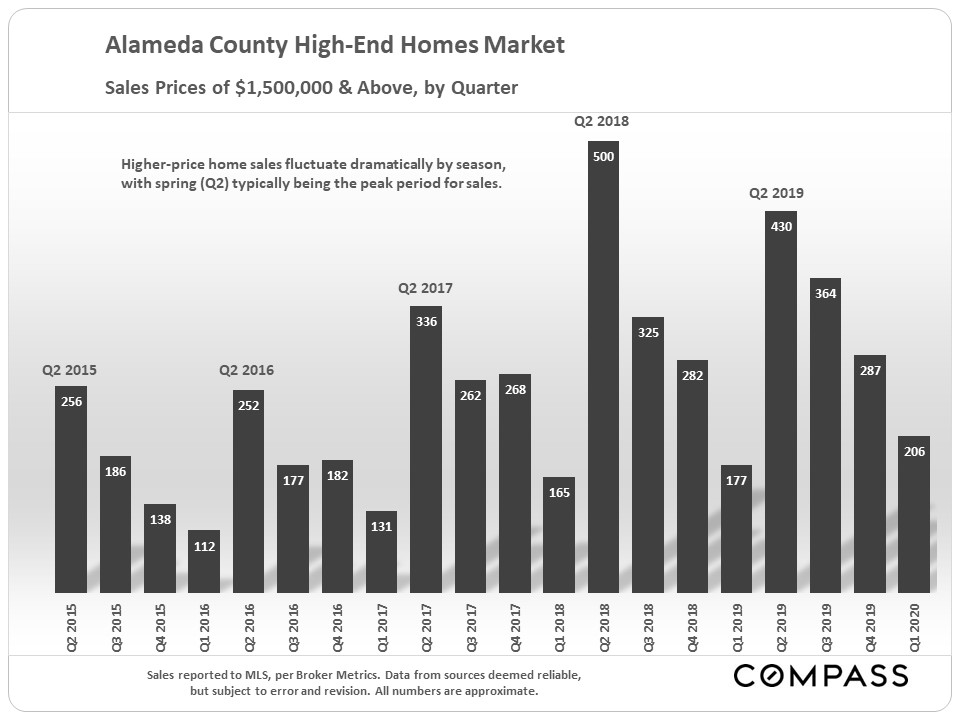
The Higher-Price Homes Market
The luxury market is fiercely seasonal, and typically spring (Q2) sees the peak in sales volume for the calendar year.
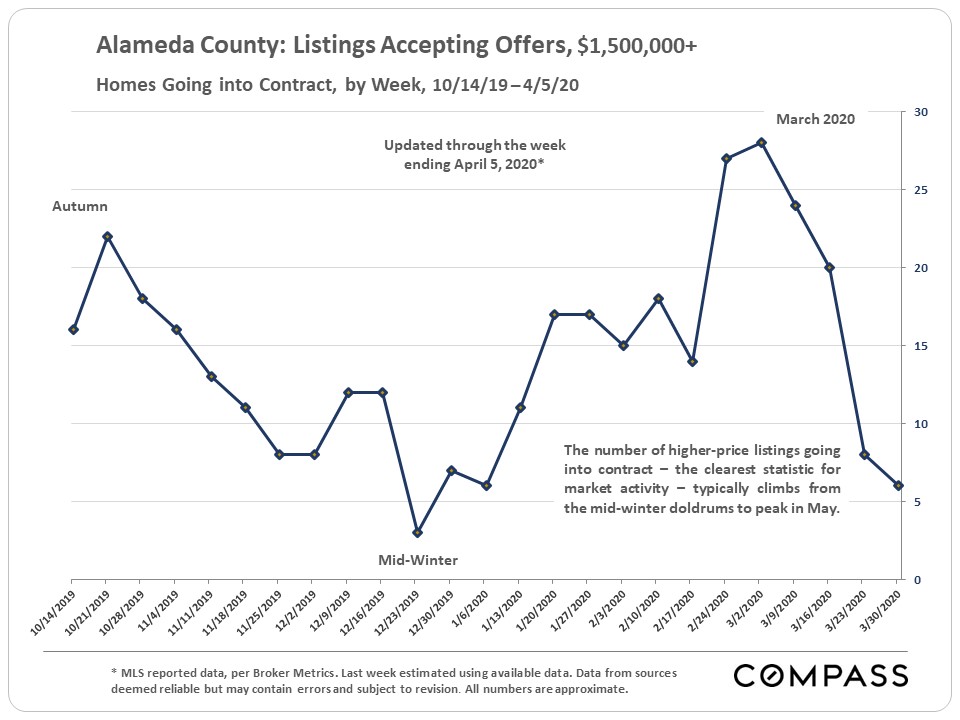
How the crisis has affected the higher price segment in recent weeks.
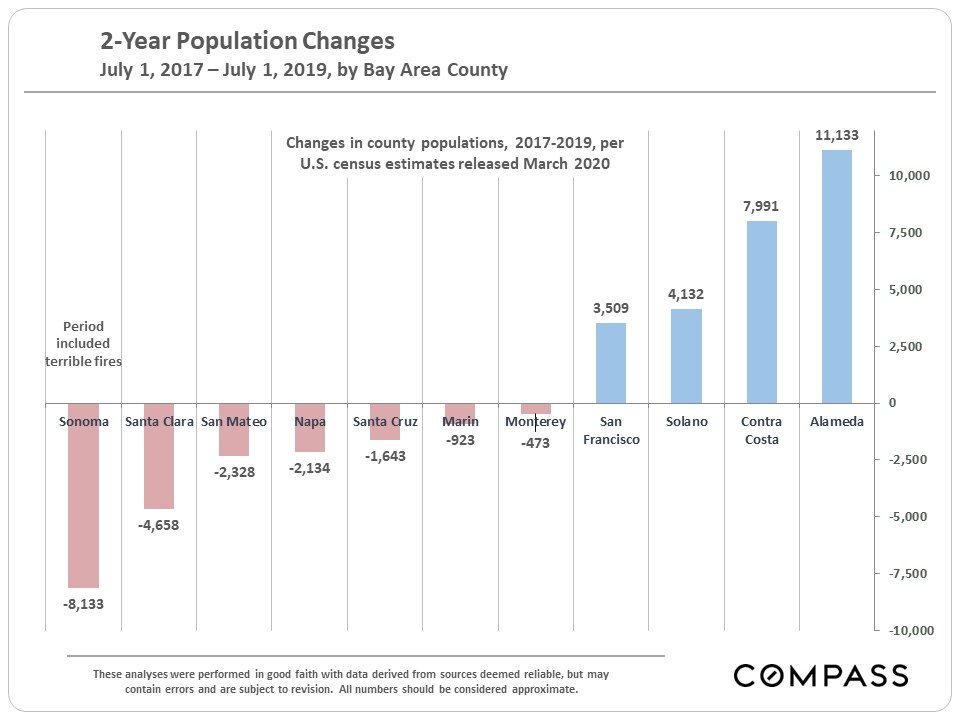
Bay Area Population Changes