Oakland-Berkeley Inner East Bay Real Estate
A Strange Year Begins Winding Down December 2020 Report
In this report, the Inner East Bay Region consists of the cities of Oakland, Berkeley, Piedmont, Alameda, Albany, Kensington, El Cerrito & Richmond, but the report will sometimes use County data as well.
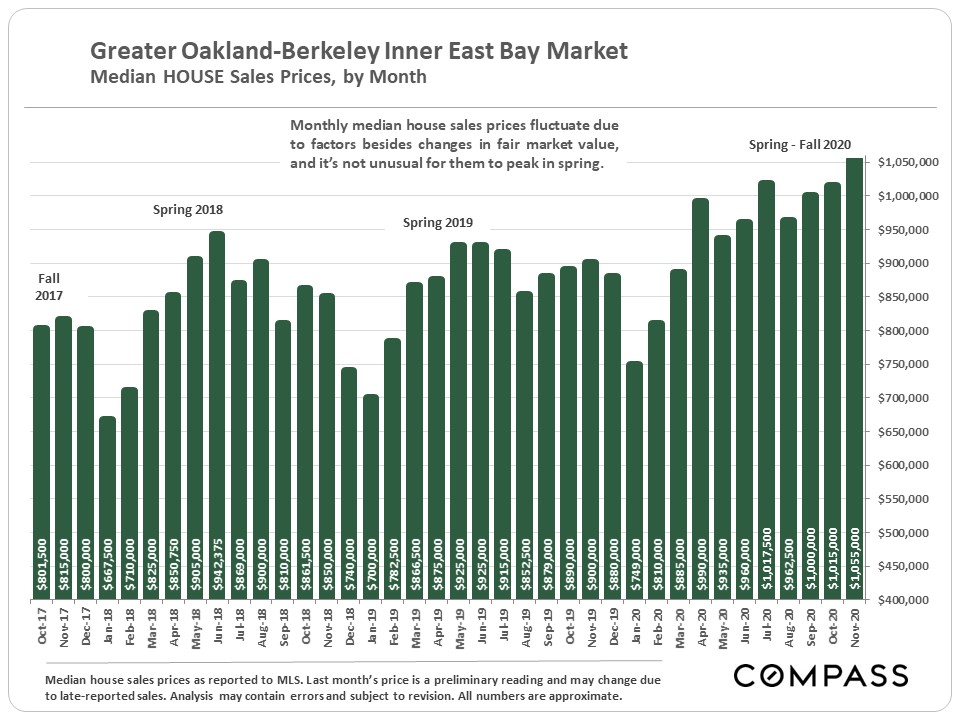
Though Covid-19 upended many normal seasonal trends this year, the market did begin its typical “holiday season” slowdown in November – however activity remained well above levels of last year. It is unknown how the latest pandemic circumstances may affect the market in December, which is usually by far the slowest month of the year.
More importantly, we hope you and your loved ones stay safe and well during this challenging holiday season.
————————————-
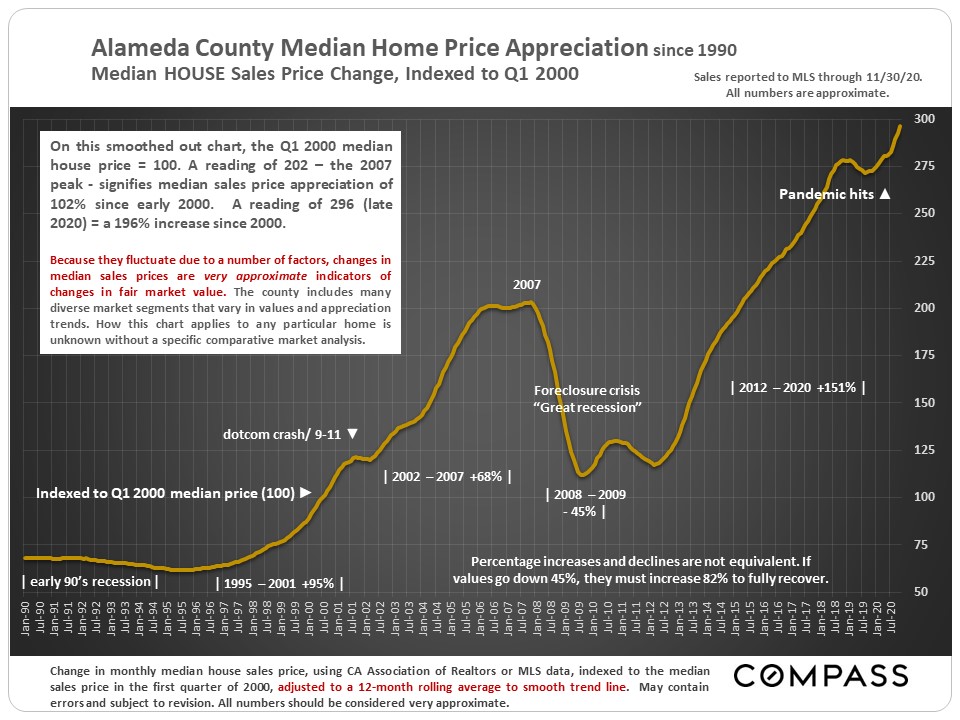
This first chart tracks percentage changes in median house sales price since 1990. It is based upon the Q1 2000 price being indexed to 100: A reading of 50 signifies a median price half that in Q1 2000; 200 means the price has doubled since then. In early 1990, the Alameda County median house price – which tracks quite well with the Inner East Bay as a whole – was about $225,000; it is currently running about $1,050,000.
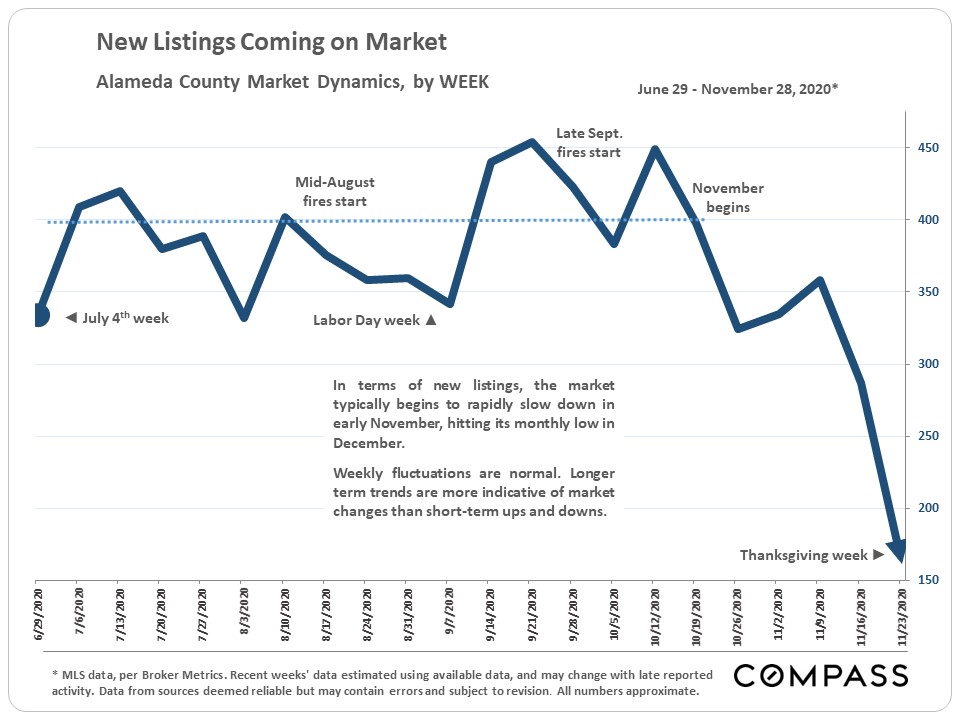
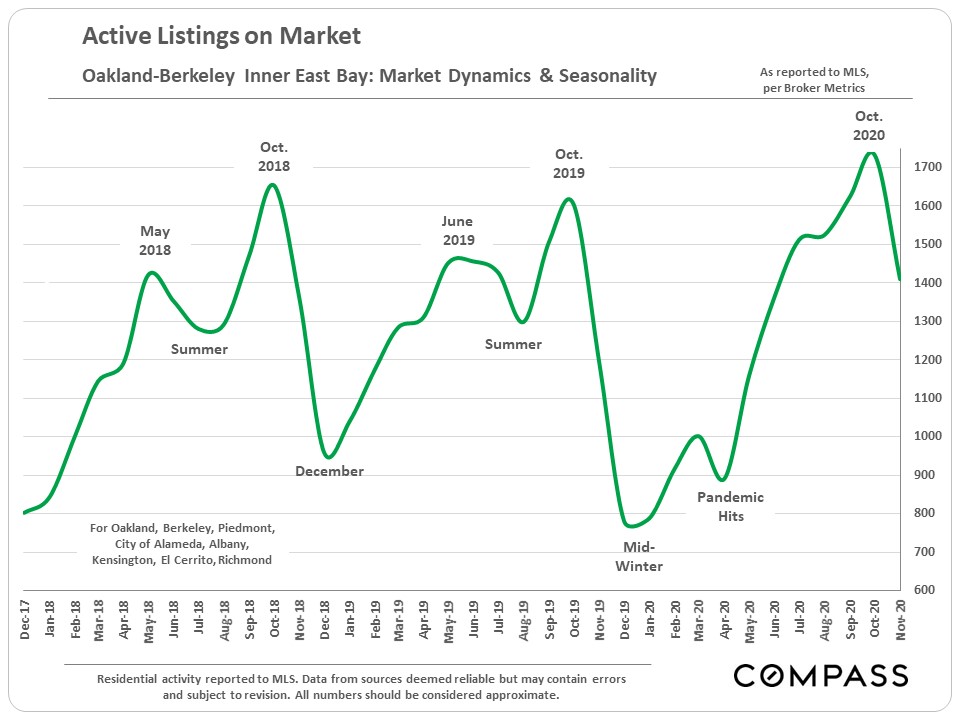
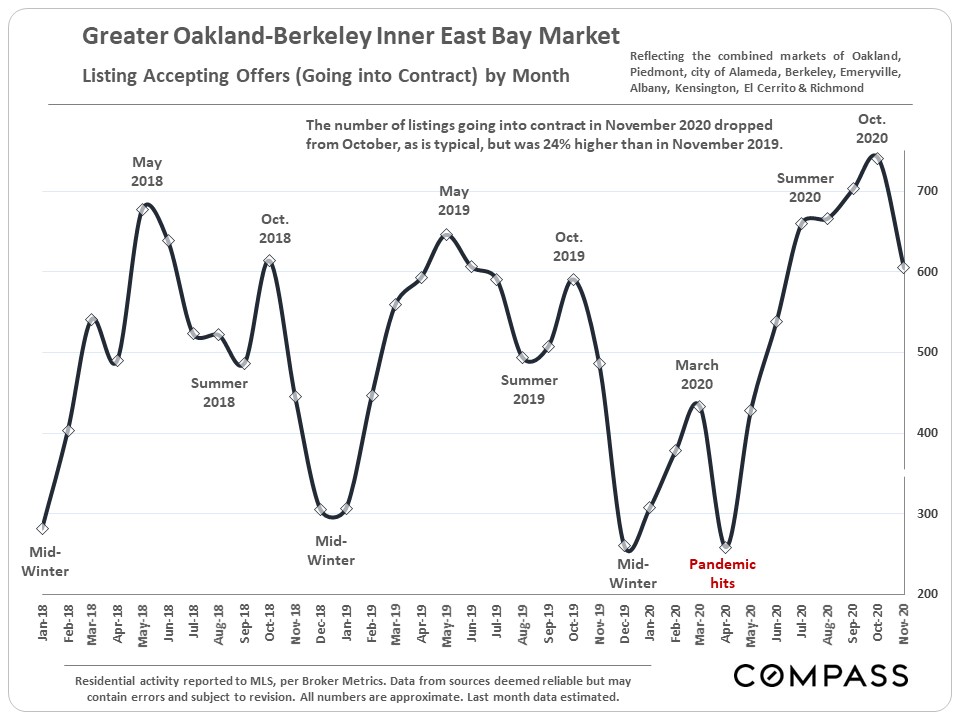
As illustrated in the next 3 charts, new listings coming on market, the total number of active listings, and the number of listings going into contract all fell in November, as is a typical seasonal trend. And they all can be expected to plunge further in December.
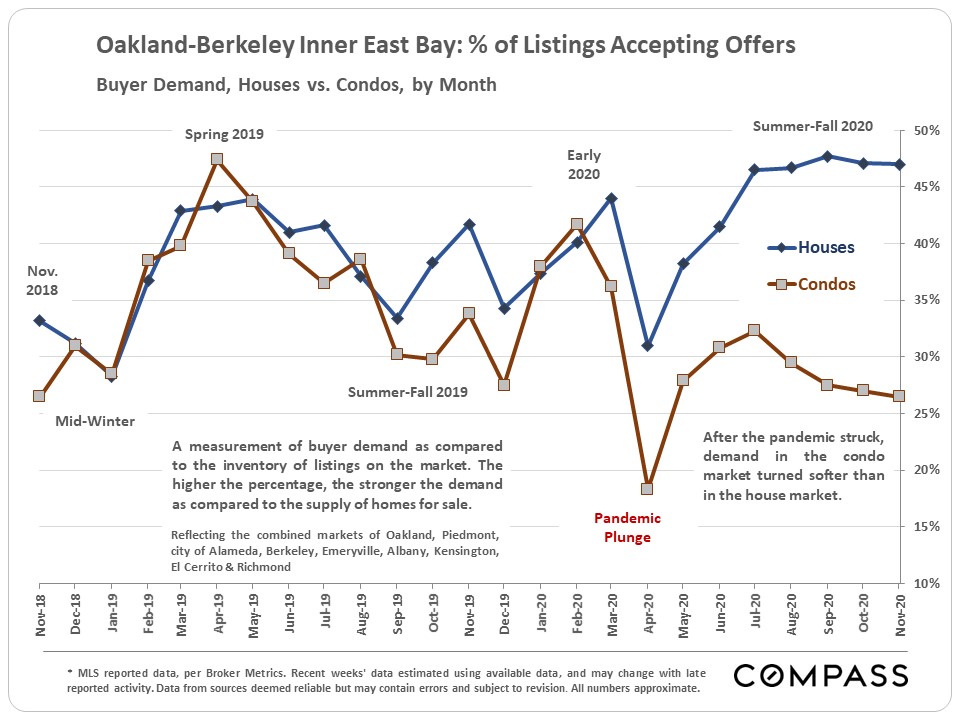
The below chart measures demand as compared to the supply of listings available to buy, i.e., the percentage of listings going into contract each month. By this metric, the Inner East Bay house market has been very strong, and significantly stronger than the market for condos. This house vs. condo divide is similar to the dynamic in San Francisco.
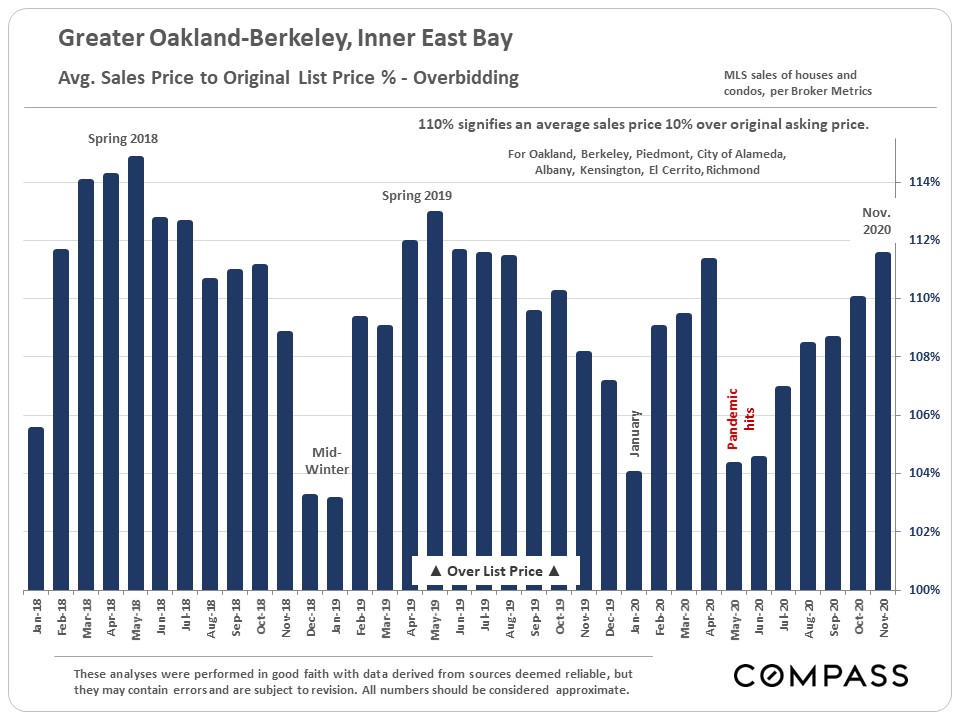
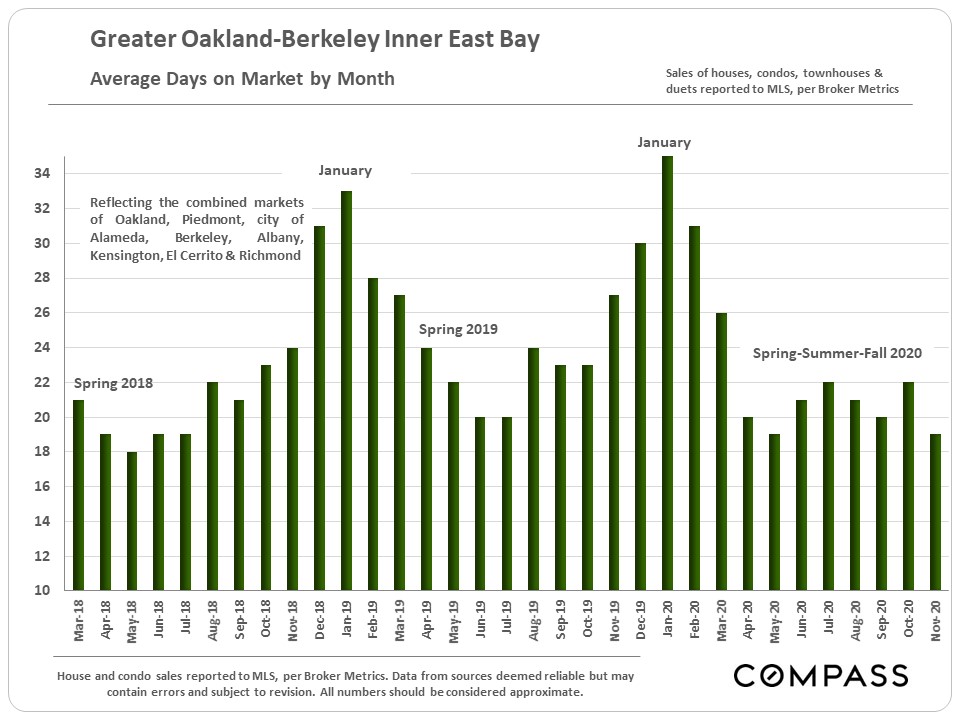
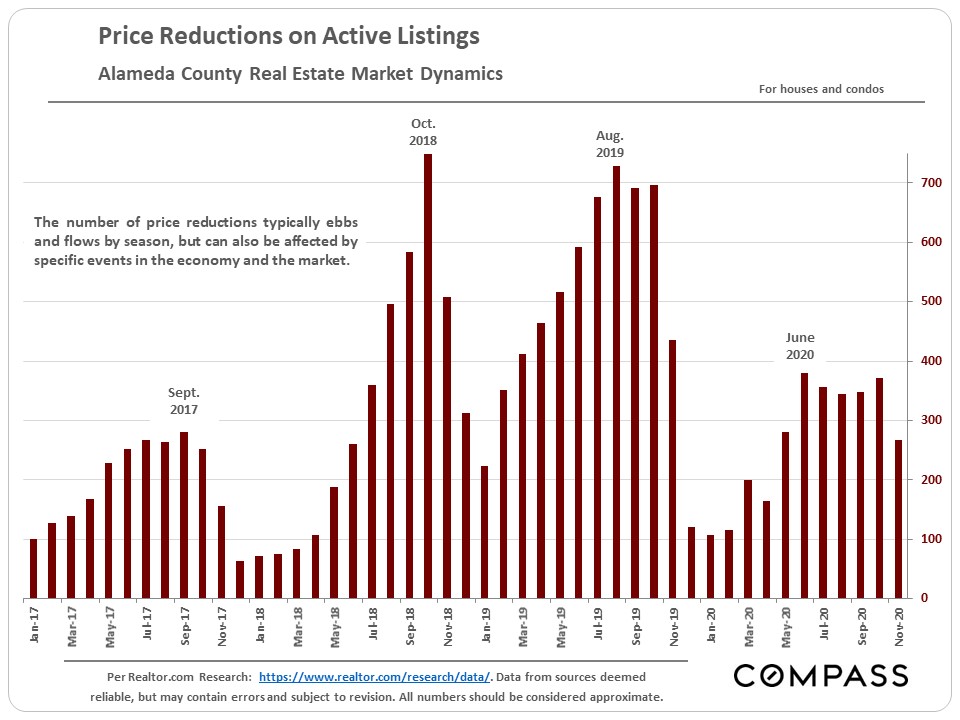
Following are 3 additional, classic measurements of buyer demand. They all reflect very healthy demand since the pandemic hit.
The biggest year-over-year increases in dollar volume sales since the pandemic hit occurred in counties where population densities are lower. Overall, Alameda County saw a small drop, but with each passing month it is getting closer to moving back into positive growth.
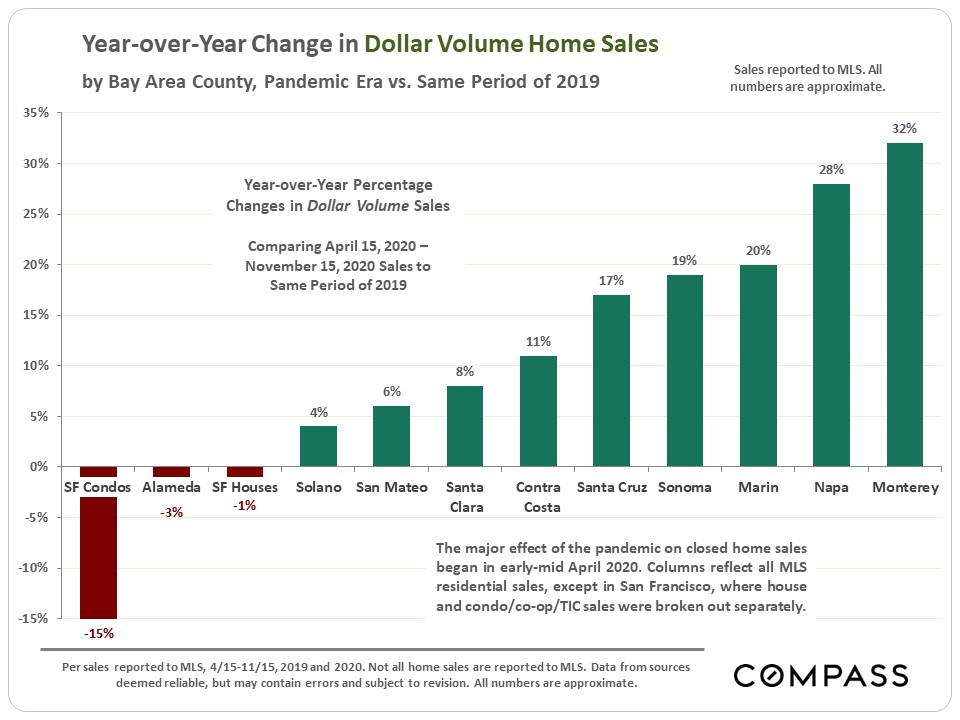
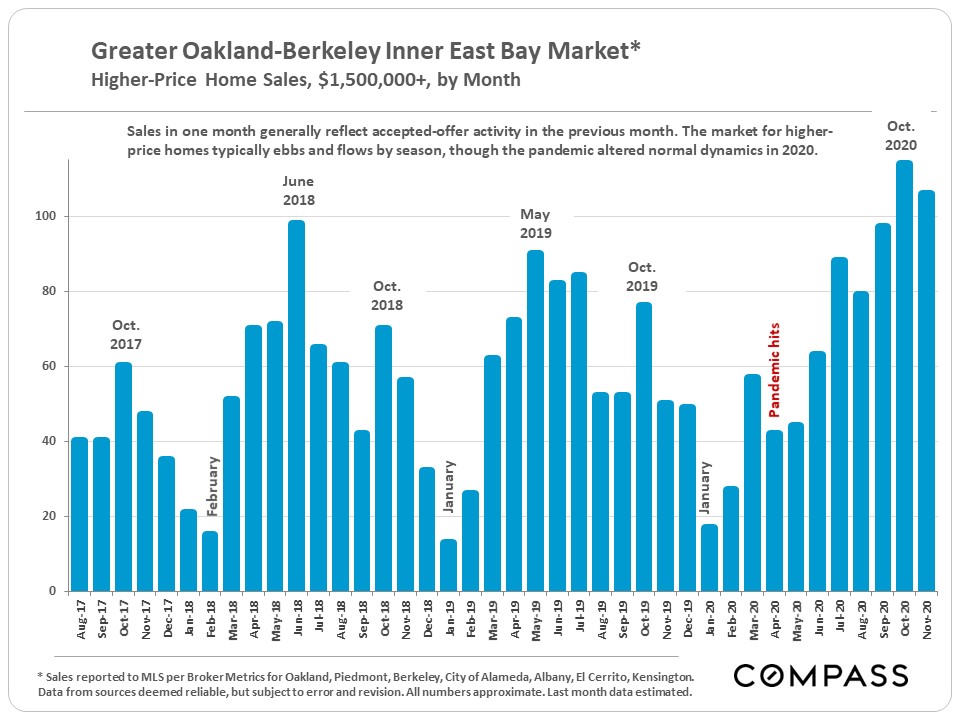
Higher price home sales have generally flourished around the Bay Area since May.
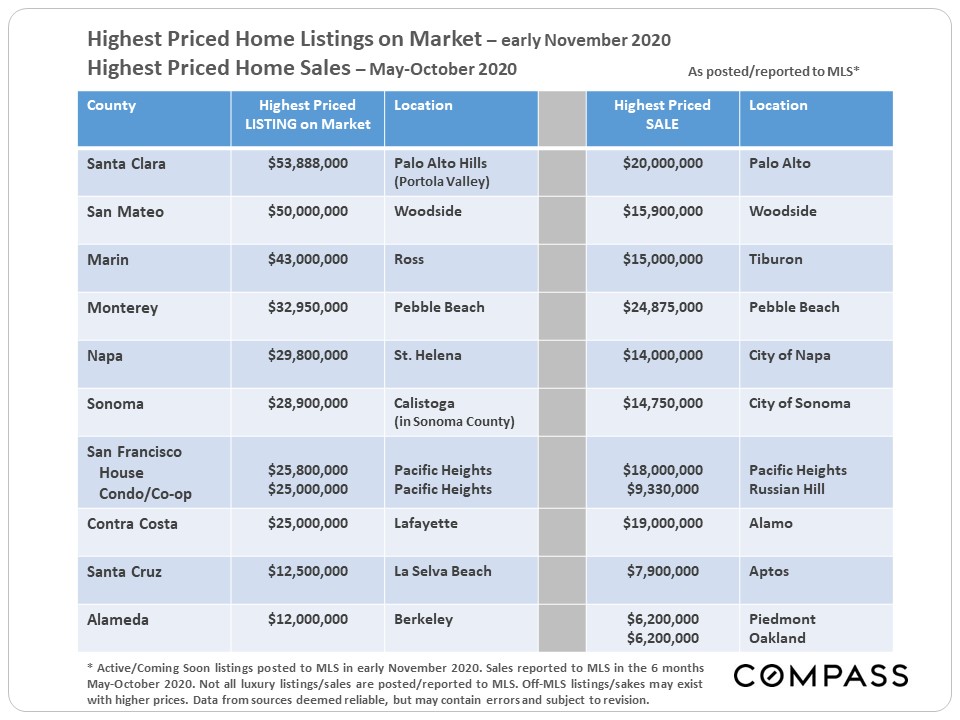
Link to our full NorCal Luxury Home Market Report
Highest priced listings on the market in early November, and the highest priced MLS home sales occurring May through October 2020, by Bay Area County.
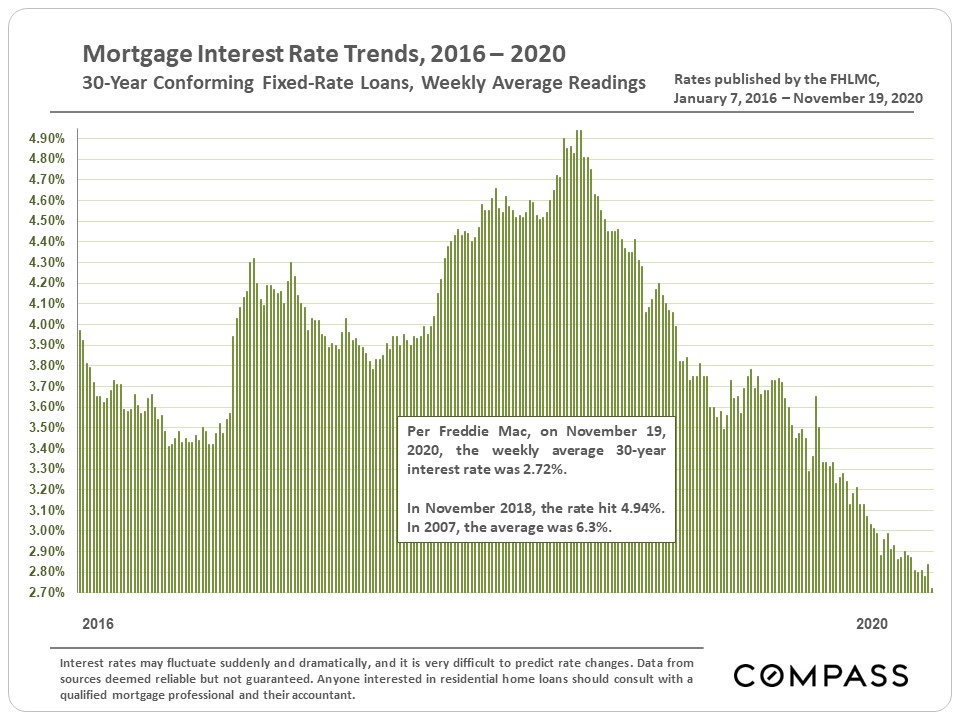
And interest rates hit yet another all-time low in early December.