Oakland-Berkeley Inner East Bay Region Real Estate
7 Months into the Pandemic
October 2020 Report
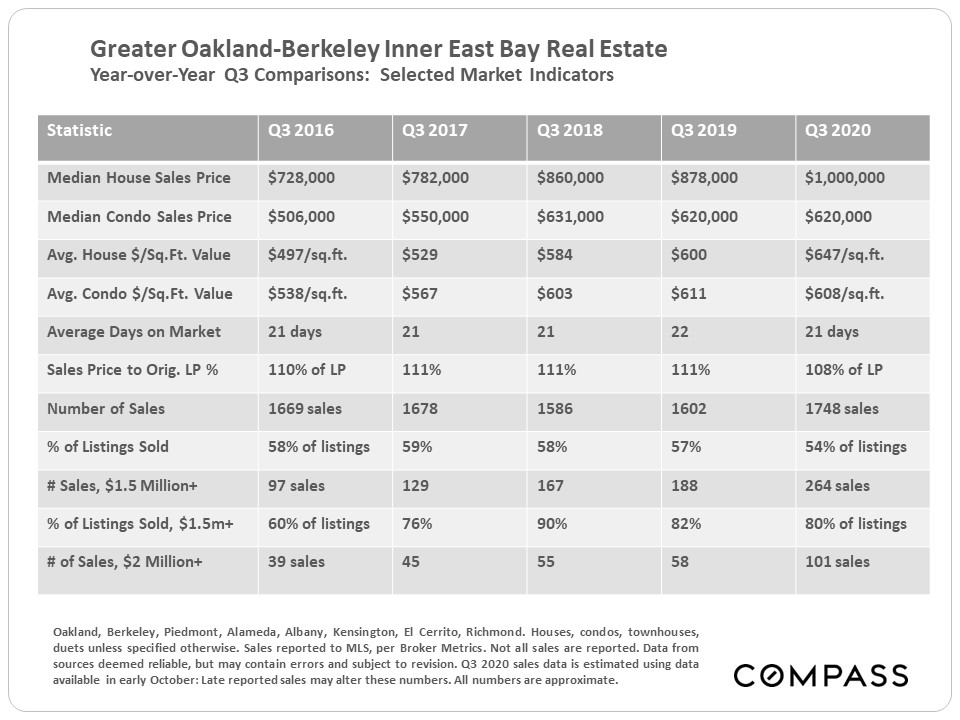
The table below compares Q3 statistics across 5 years. Median and average house values continued to rise, while condo values were relatively flat. There was an increase in the number of sales, and of higher-price home sales in particular. Overbidding declined a little, but the region still has the highest average percentage of sales price to asking price in the Bay Area. Average days on market continued to be very low, virtually unchanged for the last 5 years.
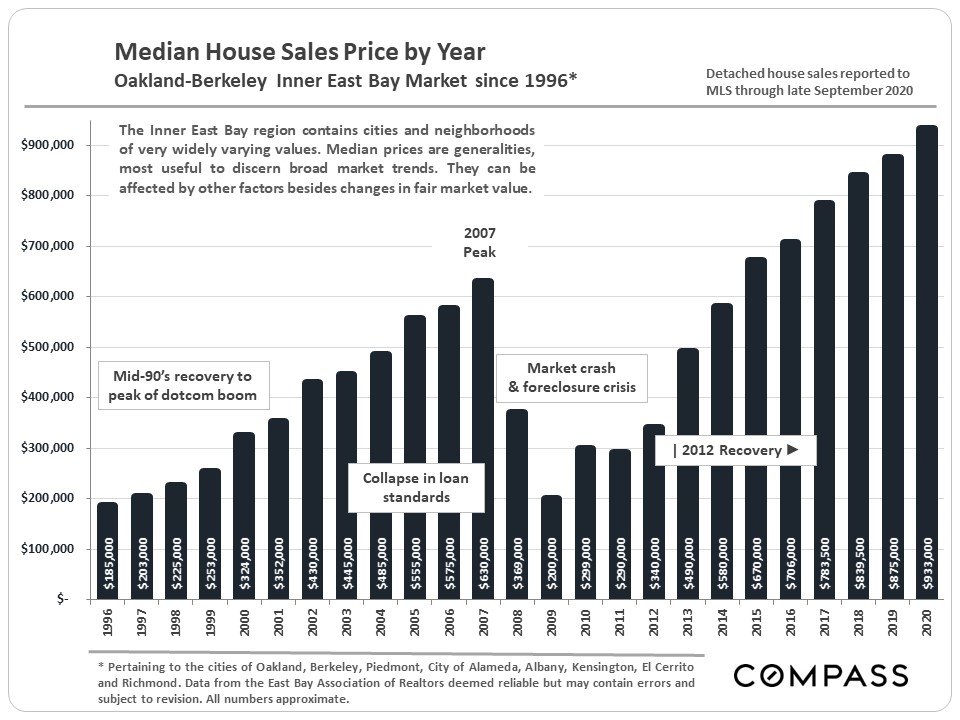
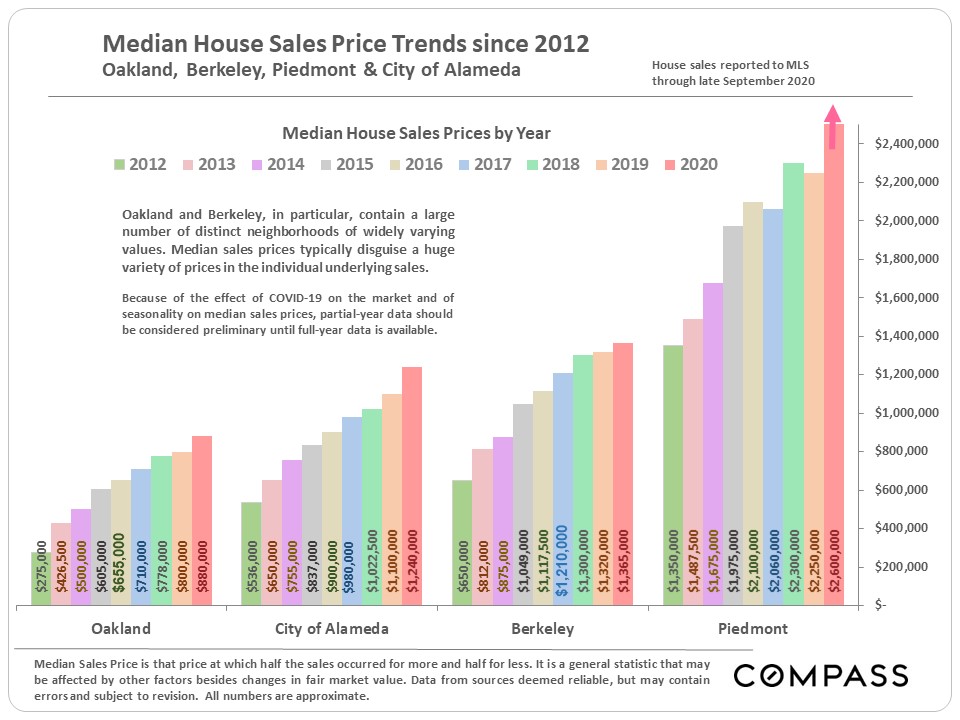
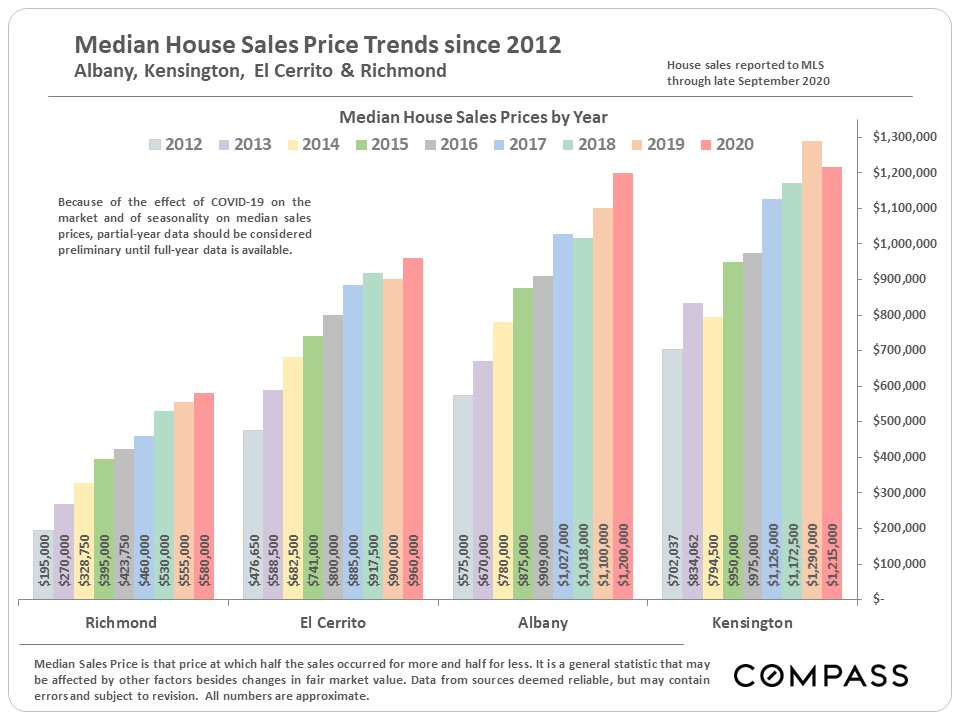
Median House Sales Price by Year
In dollar terms, the increase in median house sales price has been remarkably consistent over the past 7 years, after the big jump in 2013 when the recovery really kicked into gear.
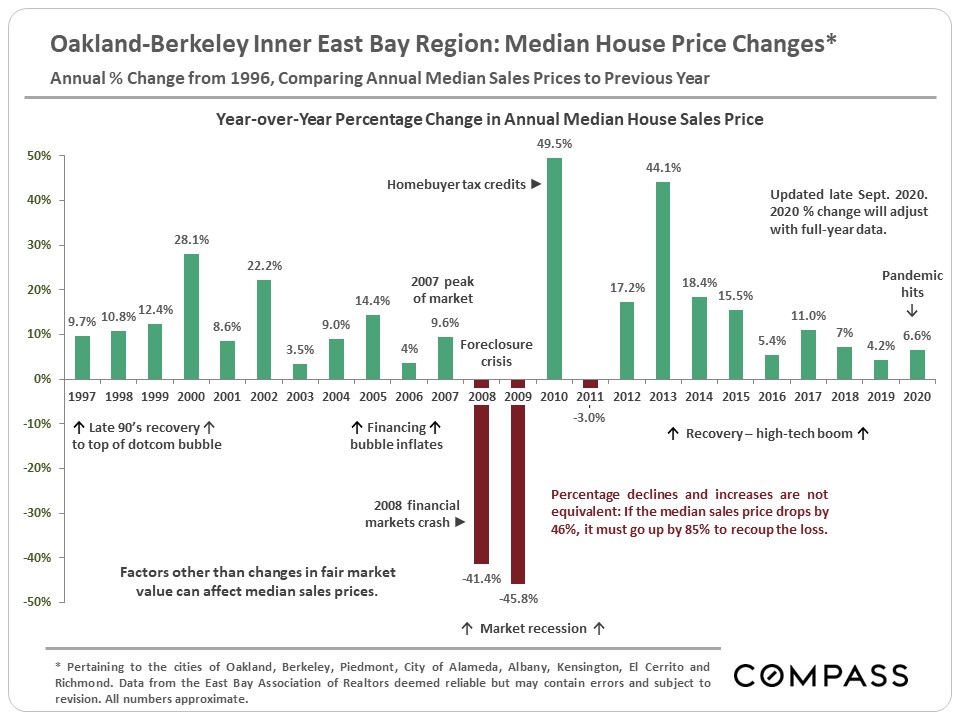
Annual Year-over-Year Changes in Median House Sales Price
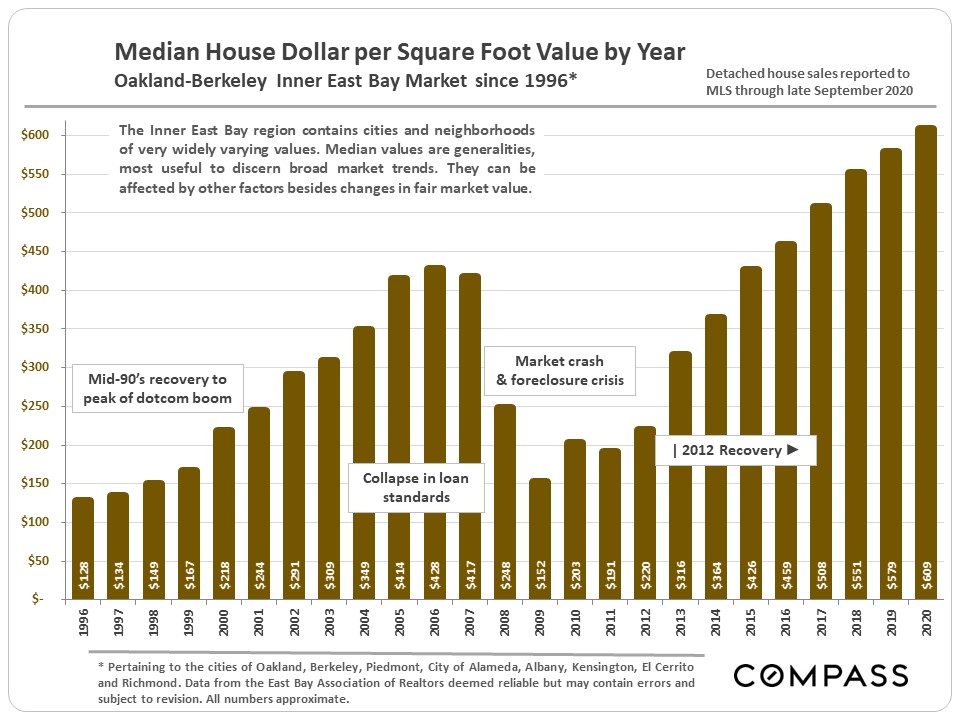
Median House Dollar per Square Foot Value
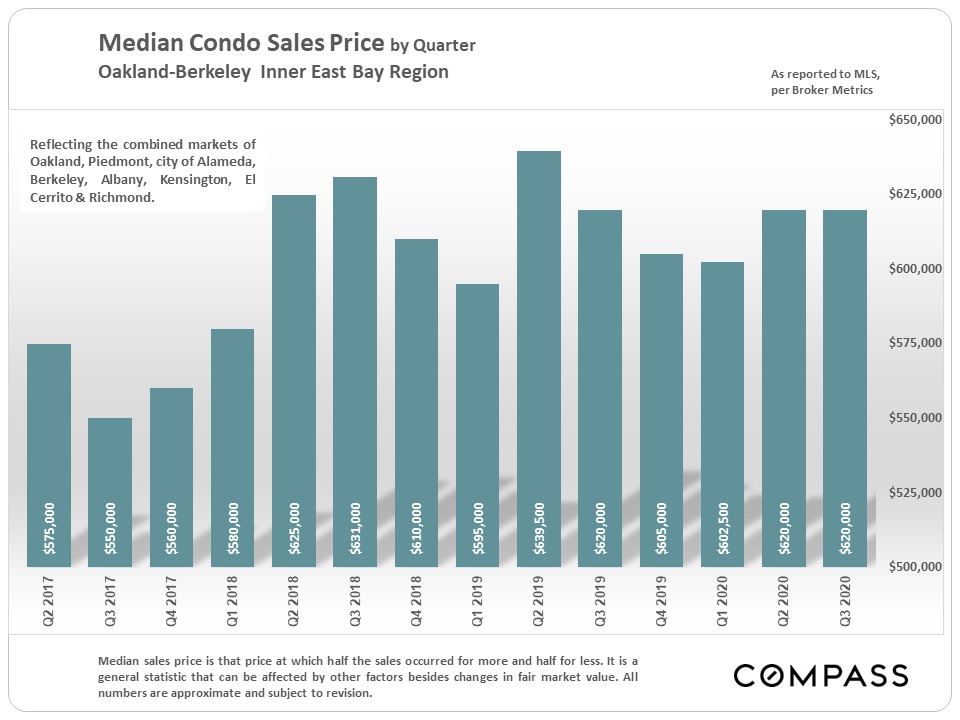
Median Condo Sales Price by Quarter
As has been the case in almost all the major condo markets in the Bay Area, the condo segment in the Inner East Bay region has been somewhat weaker than the house market.
Median House Sales Prices by City
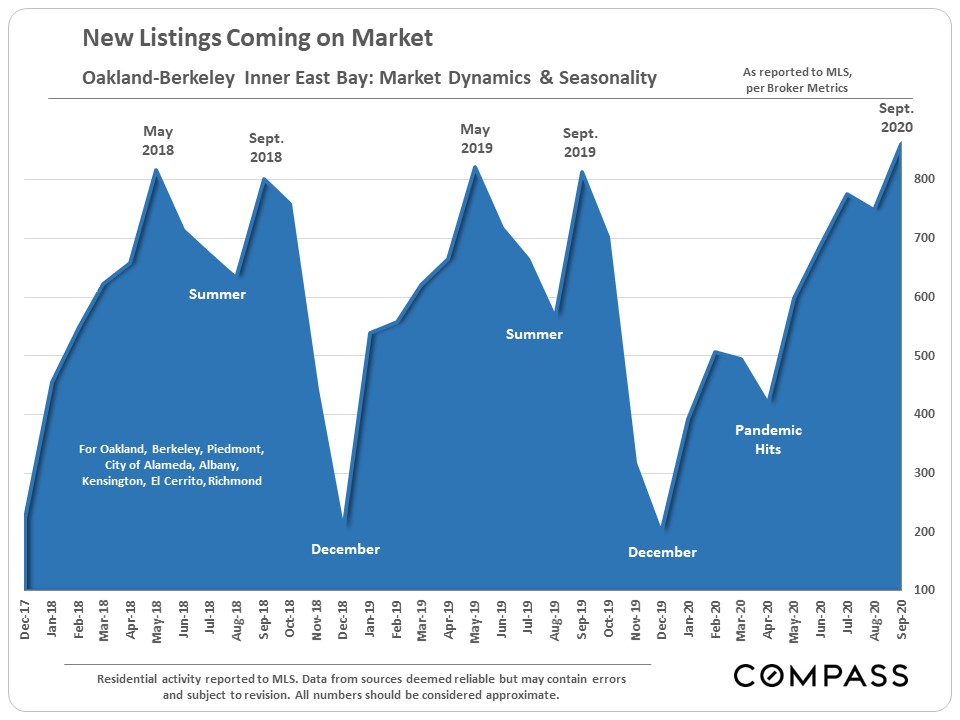
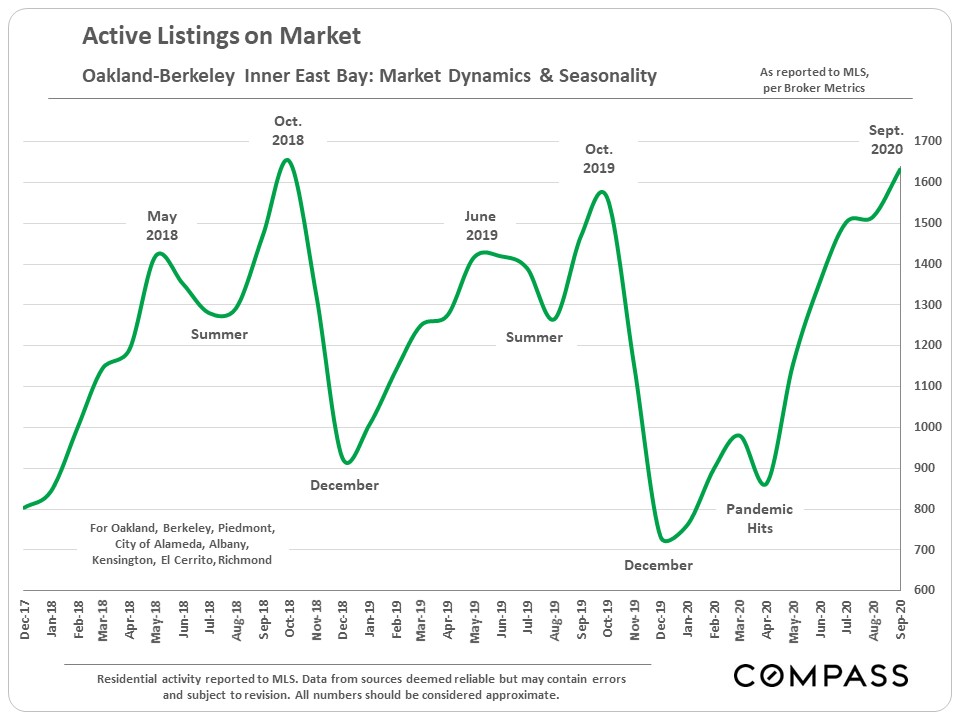
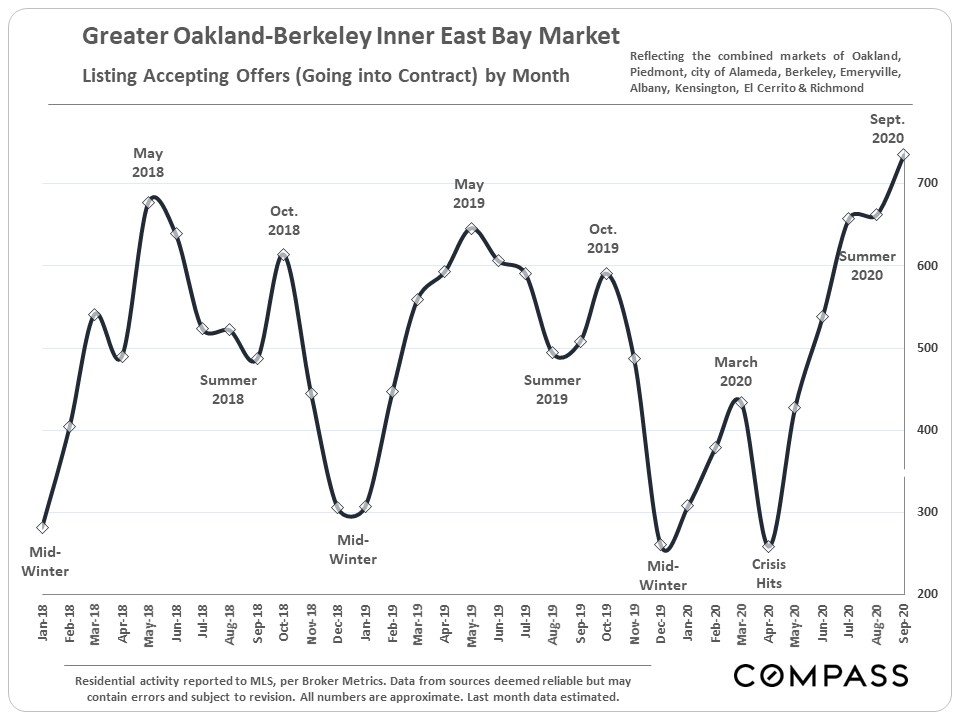
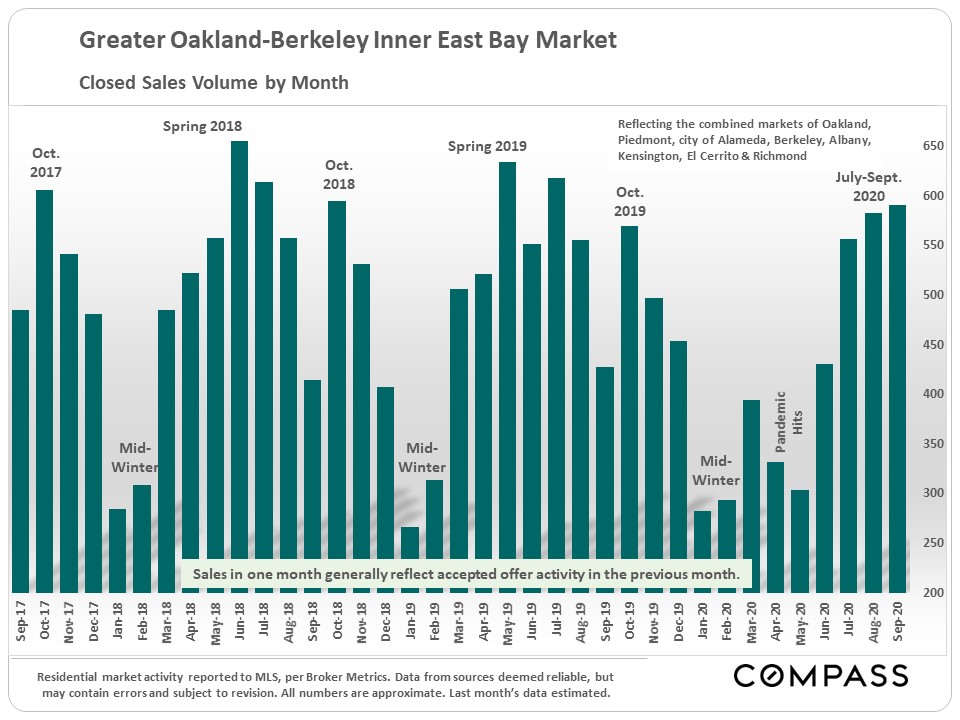
Selected Supply & Demand Indicators
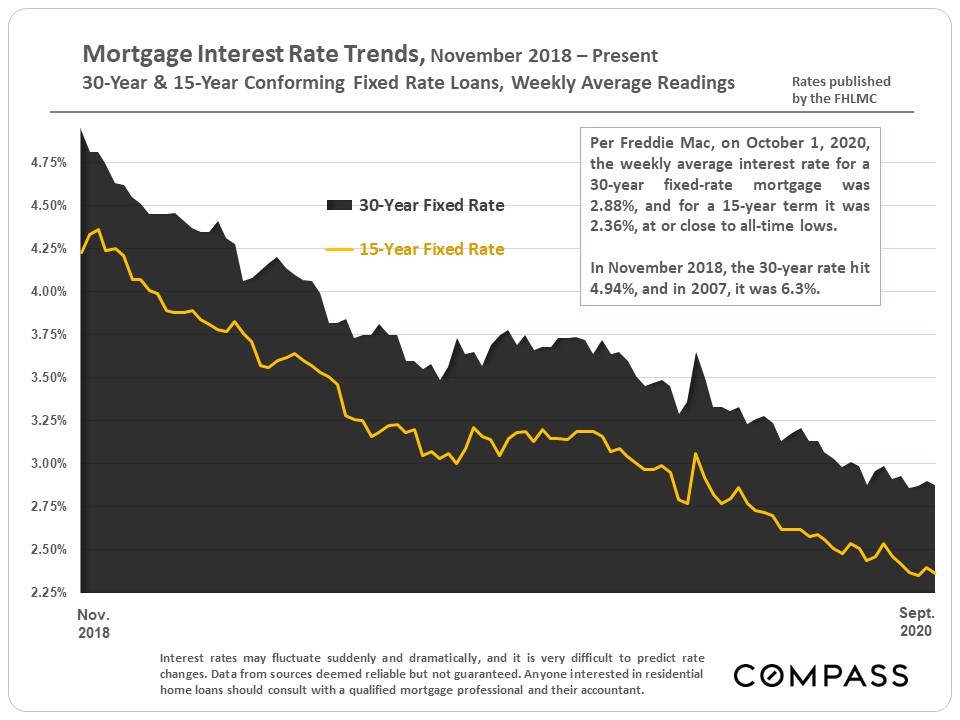
Mortgage Interest Rate Trends since Late 2018
In September, we also updated our semi-annual Survey of Bay Area Markets.