November 2019 Report on Oakland, Berkeley, Piedmont, City of Alameda, Albany, Kensington, El Cerrito & Richmond.
Using a six-month-rolling average of Alameda County monthly median sales prices smooths out monthly fluctuations to illustrate broad, long-term appreciation trends with more clarity.
The greater Oakland-Berkeley Inner East Bay region has been out-performing Alameda County in the last year or so – with prices ticking higher – as illustrated in the second chart below.
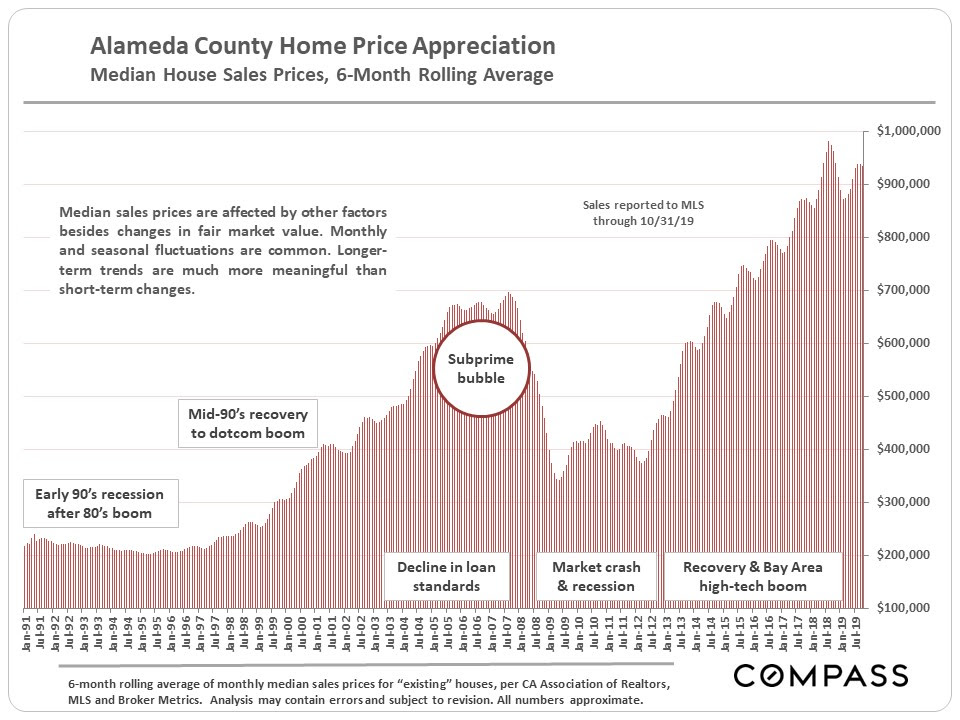
Alameda County Home Price Appreciation
This chart uses 4 cities as an example, but the trends apply to all 8 cities – in the region where northern Alameda County meets N.W. Contra Costa County – in our Inner East Bay market.
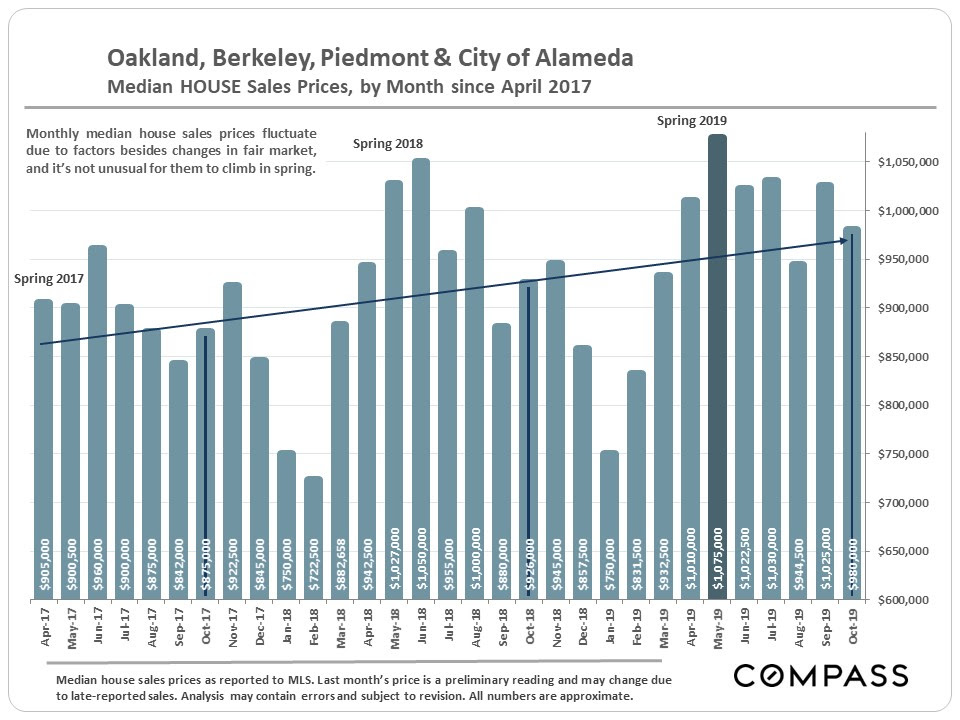
Oakland, Berkeley, Piedmont & City of Alameda
Sales & Median Values by City and Selected Oakland/Berkeley Neighborhoods
When looking at the median prices and median $/sq.ft. values below, remember that median house size can vary enormously between the different areas listed – and that, though other factors play big roles, all things being equal, a much smaller house will sell for a higher $/sq.ft. value. How these values apply to any particular home is unknown without a specific comparative market analysis.
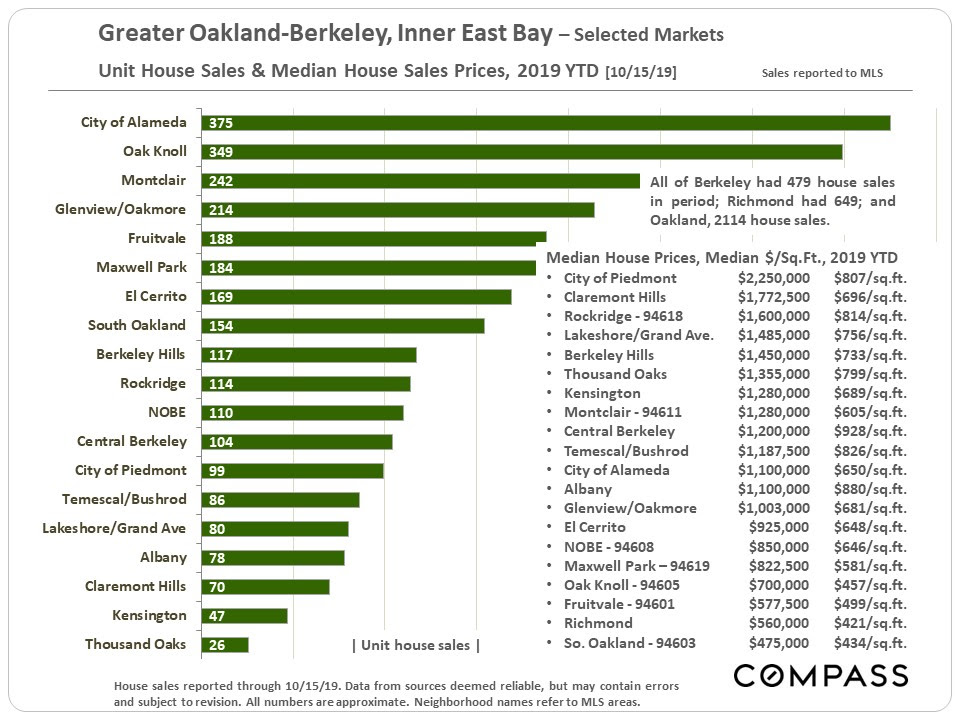
Greater Oakland-Berkeley, Inner East Bay – Selected Markets
Seasonal Trends in Market Activity
A dramatic illustration of the role of seasonality in the real estate market. Starting in November activity begins to plunge towards the mid-winter nadir. Remember that November sales mostly reflect October accepted-offer activity. Activity usually hits bottom in December, which then typically makes January the month with the lowest number of closed sales.
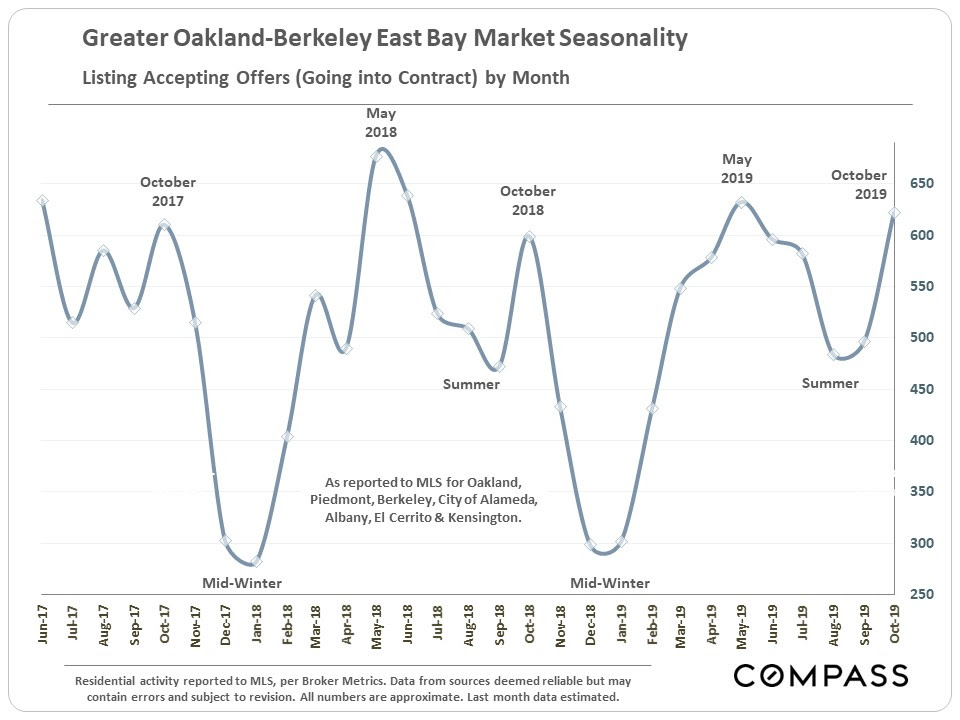
Greater Oakland-Berkeley East Bay Market Seasonality
Sales vs. Listings for Sale by Price Segment
In virtually every other market in the Bay Area, there are significant imbalances in supply and demand in certain price segments, typically the highest-price ranges. But the greater Inner East Bay market remains remarkably balanced in comparison, and here the lowest price segment (under $500,000) has the somewhat weaker dynamics vis a vis the percentage of sales vs. the percentage of listings for sale. The higher price segments remain very strong.
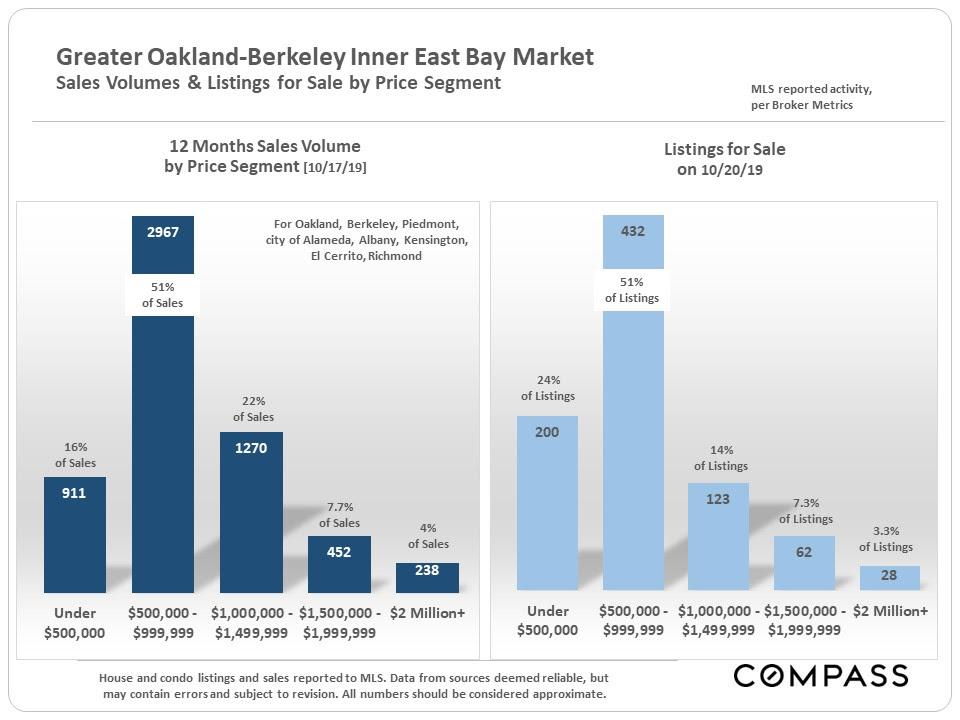
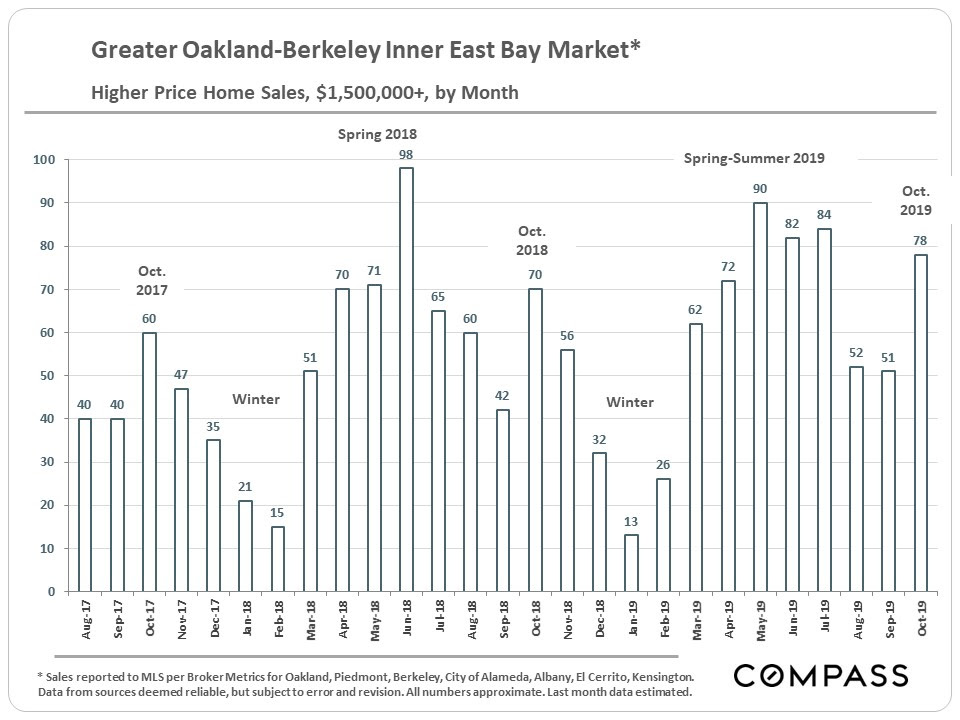
Greater Oakland – Berkeley Inner East Bay Market
Homes Selling for $1.5 Million+ by Month
Homes in the higher price ranges are a much better value in this region than in San Francisco across the bay, keeping demand strong.
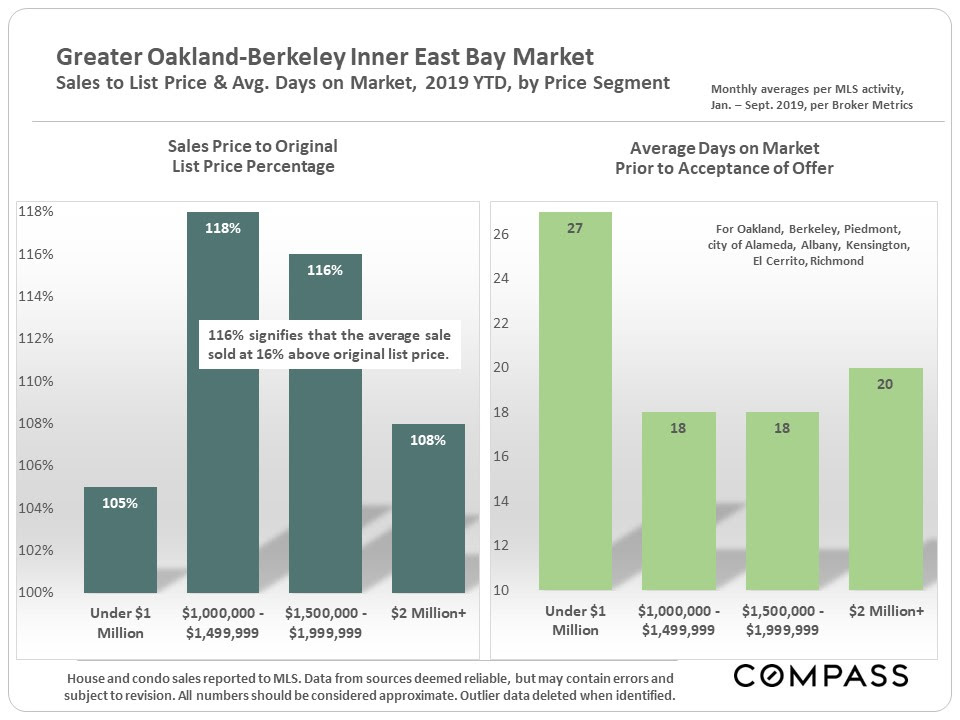
Greater Oakland-Berkeley Inner East Bay Market
Market Dynamics by Price Segment
All our price segments have strong dynamics relative to other Bay Area markets (or historical markets), but the demand for homes between $1 million and $2m is amazingly strong – on average, these homes are selling very, very quickly at tremendous percentages above list price.
Greater Oakland-Berkeley Inner East Bay Market
Percentage of Sales Selling without Prior Price Reduction
The 2 following charts illustrate comparative year-over-year market dynamics as well as market seasonality within the calendar year.
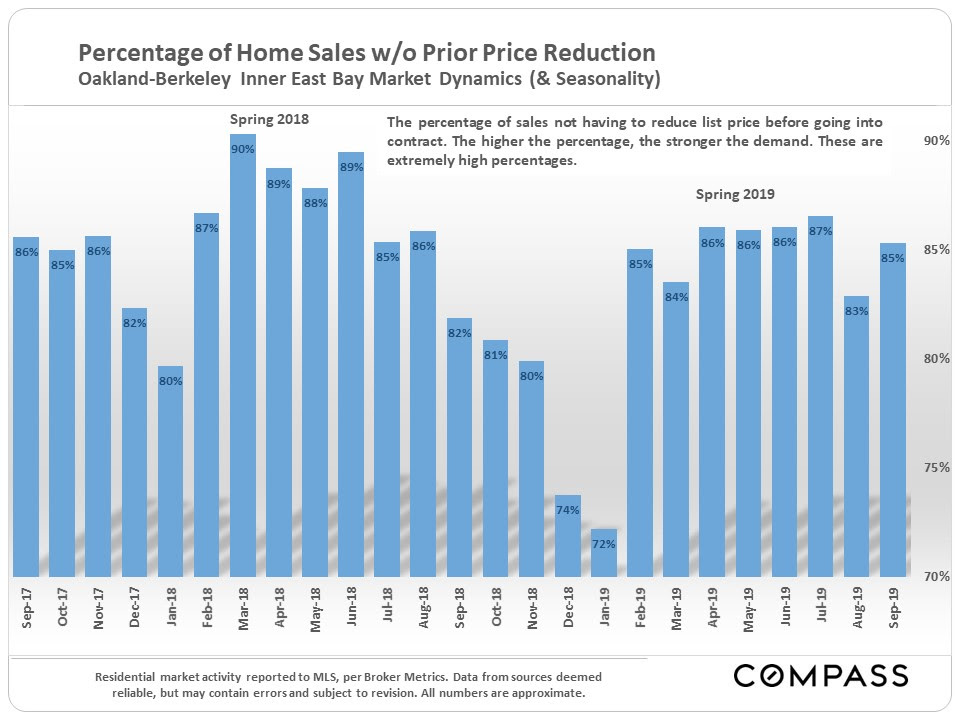
Percentage of Home Sales w/o Prior Price Reduction
Ratio of Withdrawn (No-Sale) Listings to Listings Sold
The ratio of listings withdrawn from the market, to sold listings – one indicator of pricing and buyer demand – ticked up in November 2018 – January 2019, but did not see the huge year-over-year jumps some other Bay Area markets experienced. Based on prevailing dynamics, we do not currently expect a large change in the inner East Bay market in the next few months.
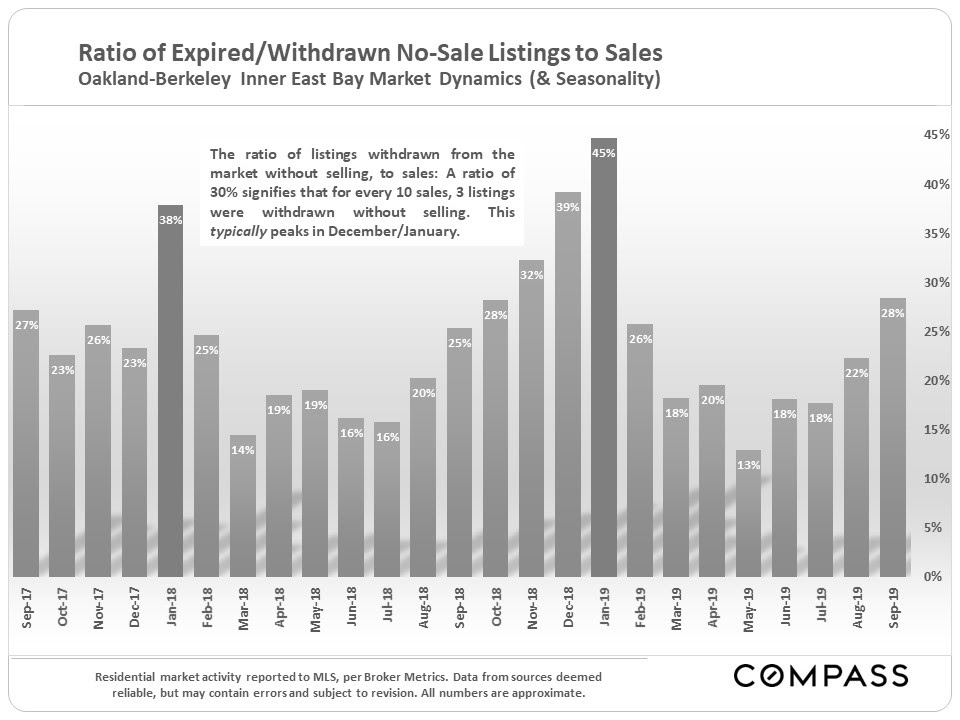
Ratio of Expired/Withdrawn No-Sale Listings to Sales
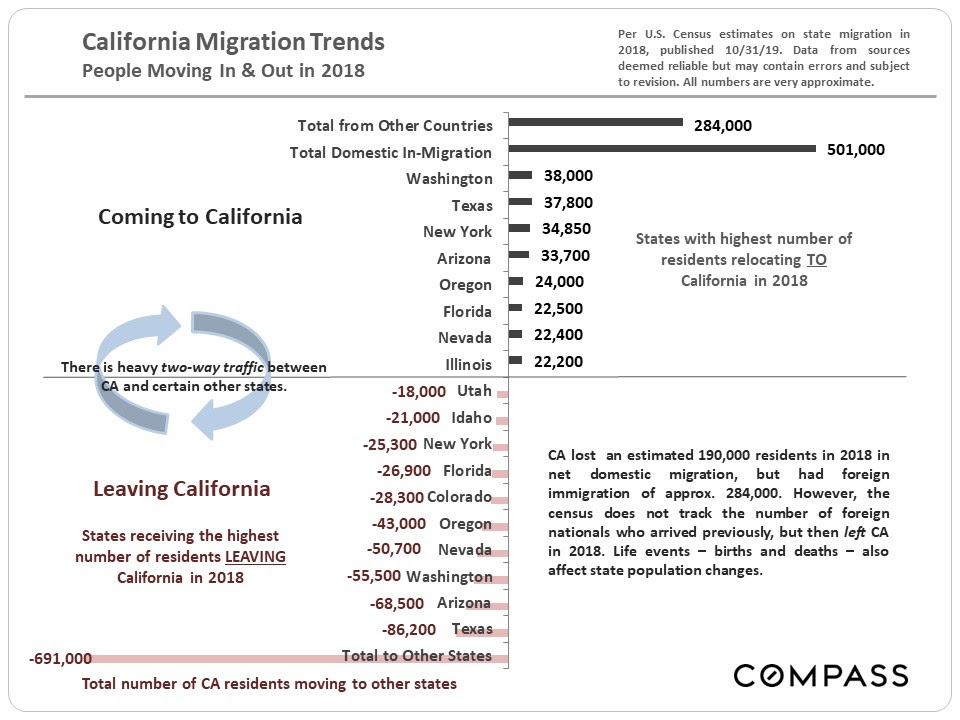
People Moving in & out of CA in 2018
According to new census estimates, approx. 501,000 people from other states moved to CA in 2018, while 691,000 Californians relocated to other states – a net loss of 190,000. In addition, an estimated 284,000 foreign nationals moved into CA from outside the country. (Foreign out-migration numbers are not available.)
The top states for out-migration are Texas, Arizona, Washington, Nevada & Oregon, states with high-tech centers of their own and/or no state income taxes, and/or significantly lower housing costs – thus attracting working residents, local businesses, and retirees. Updated Bay Area figures are not yet available, though migration trends here have generally paralleled state trends in recent years.
The situation in our Inner East Bay region is somewhat different, affected by the migration of residents from much more expensive San Francisco (and, to a lesser degree, from San Mateo County).
California Migration Trends
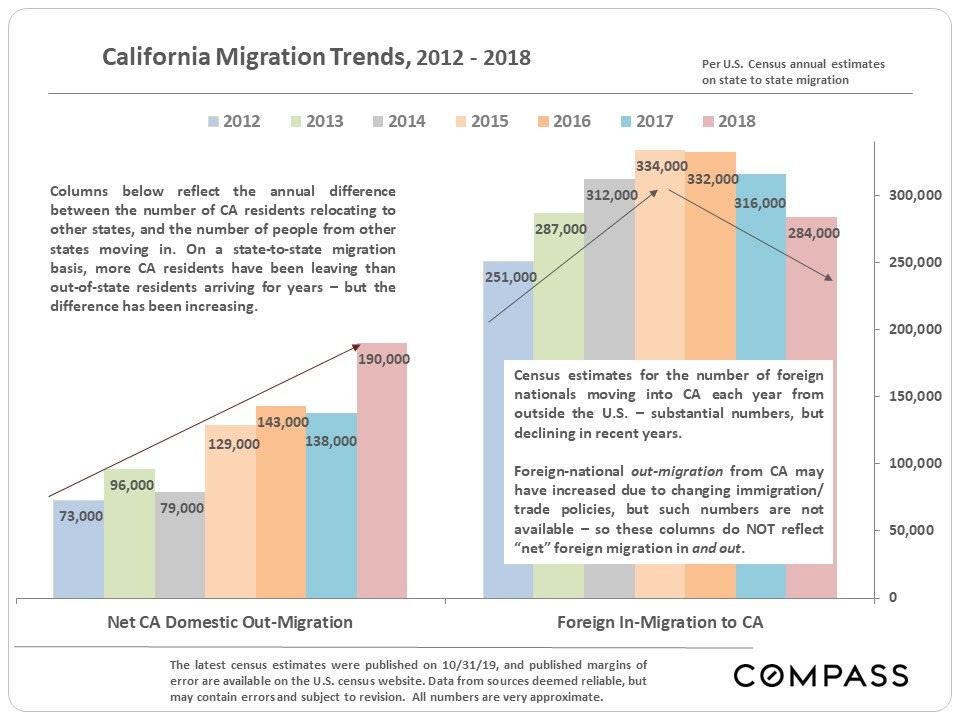
California Migration Trends, 2012-2018