October 2019 Report
Q3 2016 – Q3 2019
The Inner East Bay and San Francisco markets remain the strongest in the Bay Area. Most other local markets have seen cooling indicators in year-over-year statistics and declines in median home sales prices, but not in the closely related markets across the Bay Bridge from each other.
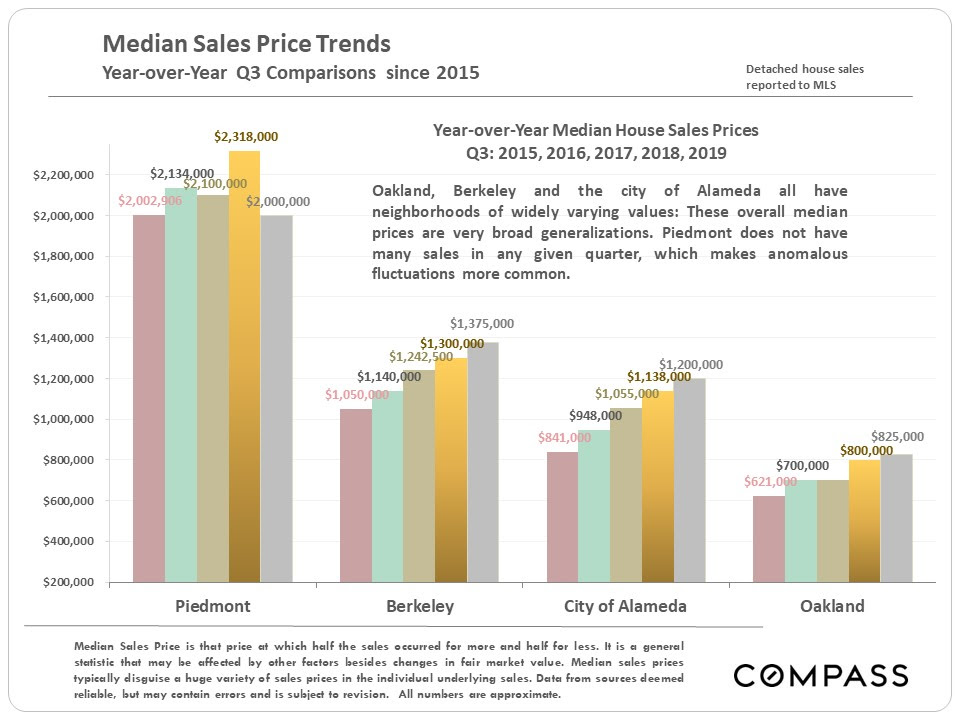
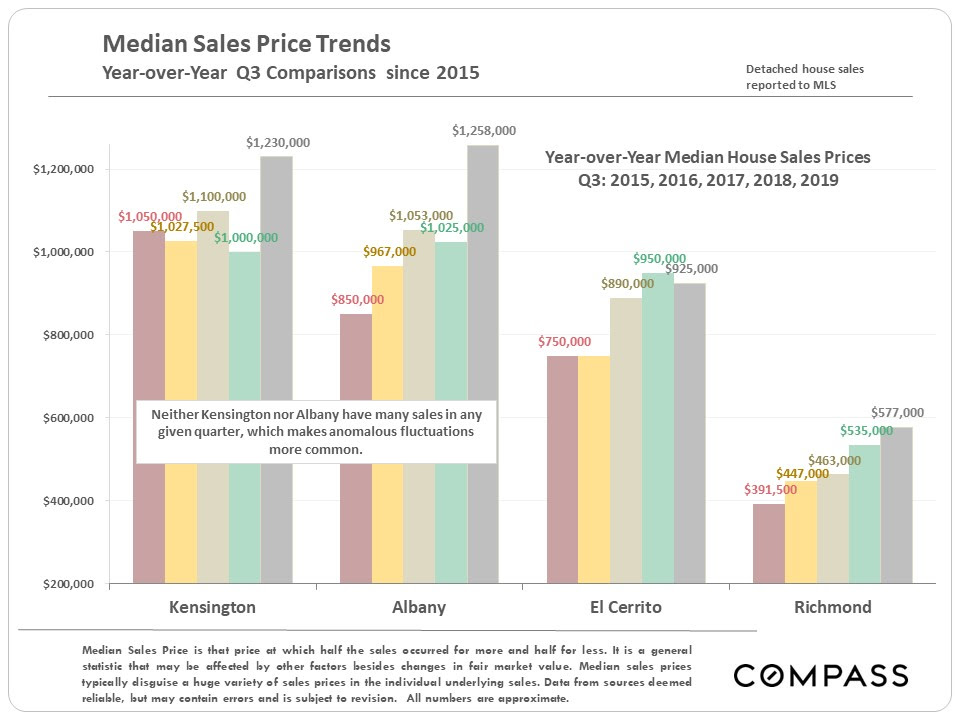
City Median Home Prices by Quarter
Looking at quarterly home prices by city can be an iffy proposition simply due to the sometimes low number of sales occurring within a particular quarter: The fewer the sales, the less reliable the statistics. In the chart below, note that Piedmont, Kensington and Albany have relatively low numbers of sales and the dramatic year-over-year Q3 changes are probably anomalous. In a few months, we will tally annual median home price changes by city, which will be much more meaningful as indicators of appreciation.
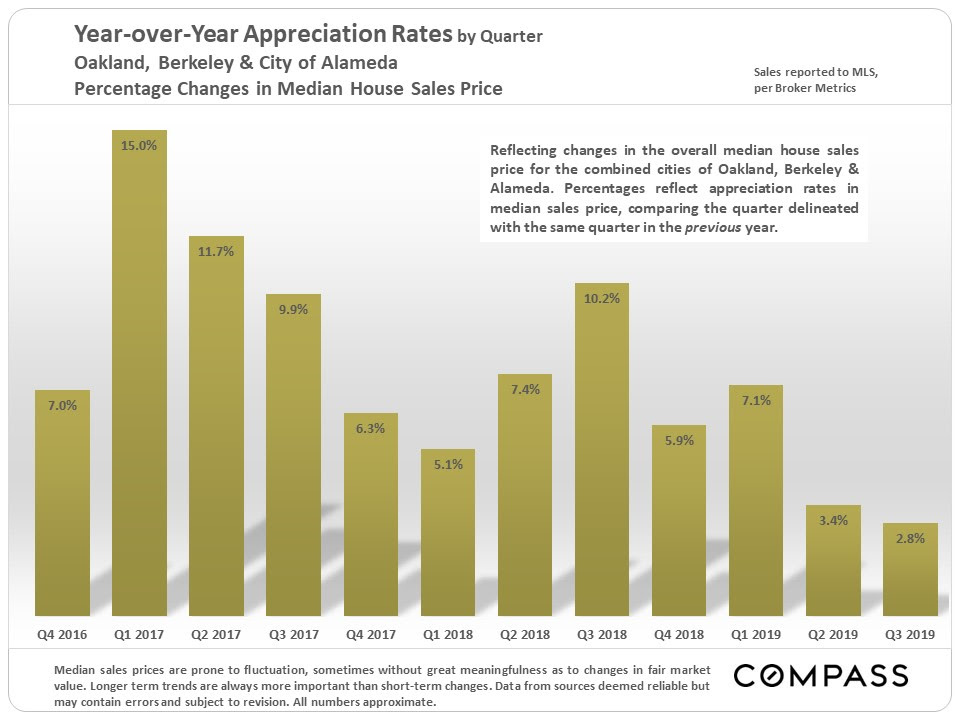
The below chart uses the combined median house sales price of Oakland, Berkeley and the City of Alameda – all relatively good-sized markets – as an illustration of regional home-price trends. Though year-over-year appreciation rates have mostly declined in the past 4 quarters from the very high rates seen in previous years, the continued increases are not insignificant.
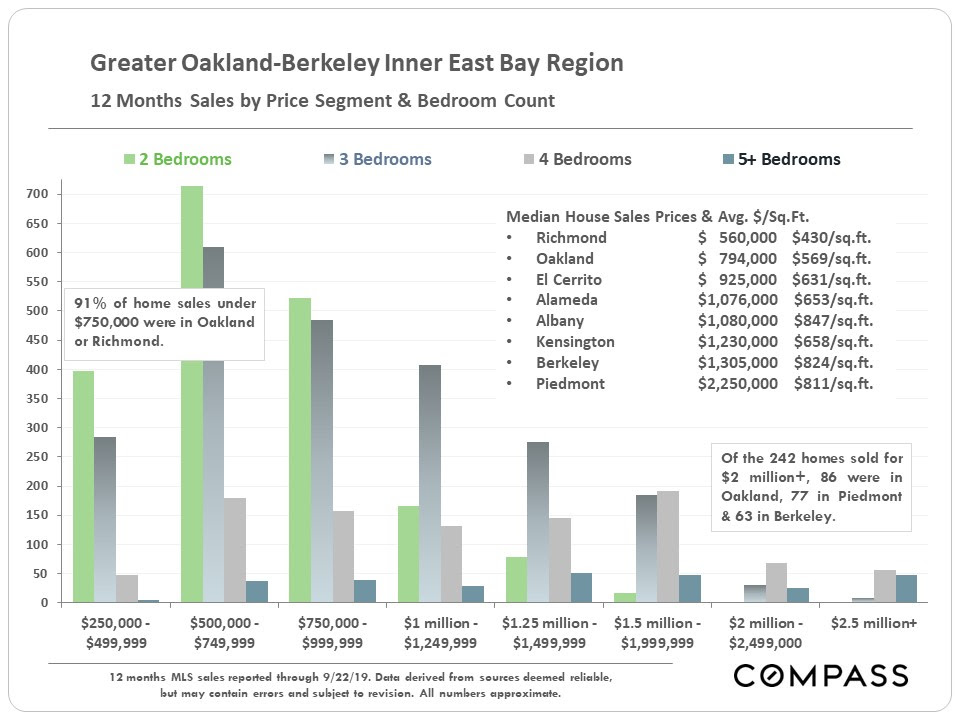
Home Sales by Price Segment & Bedroom Count – 12 Months Sales
Oakland and Richmond are by far the largest markets in the region, and sales in their most affordable neighborhoods account for the tallest columns on the left side of the chart. Sales in more expensive communities, and more expensive neighborhoods in Oakland, are mostly reflected in the lower columns further to the right.
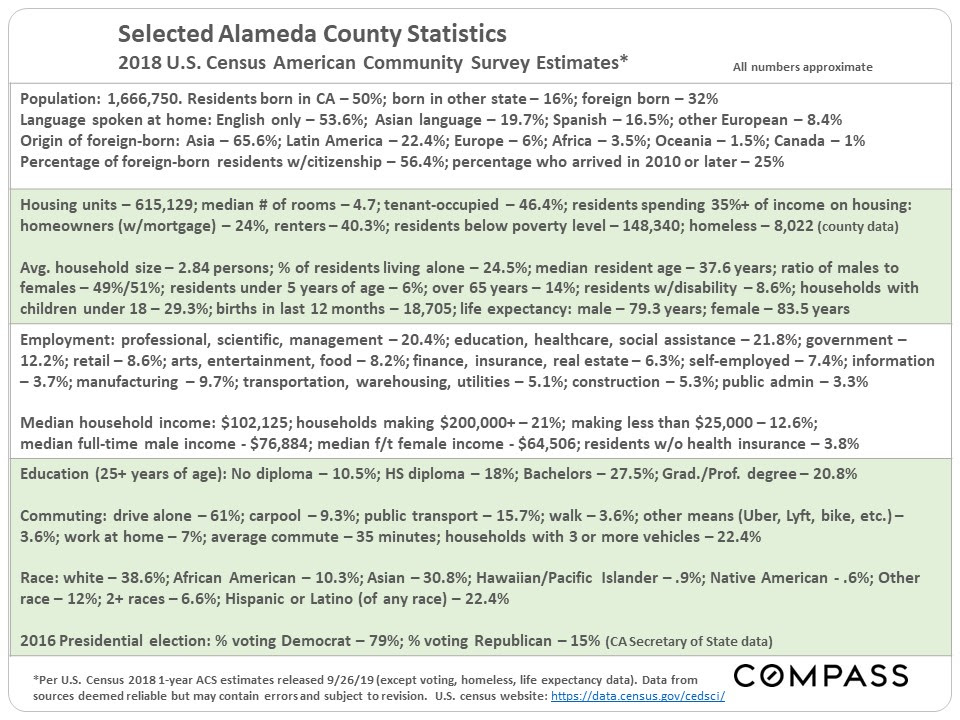
Updated County Statistics
Underlying the real estate market are the changing details and circumstances of its population. At the end of September, the U.S. Census released its 2018 American Community Survey 1-year data estimates for a broad range of economic, social and demographic statistics. Below is a selection of survey insights into Alameda County, plus 2 or 3 statistics from other sources. (You may want to expand this slide for easier reading.)
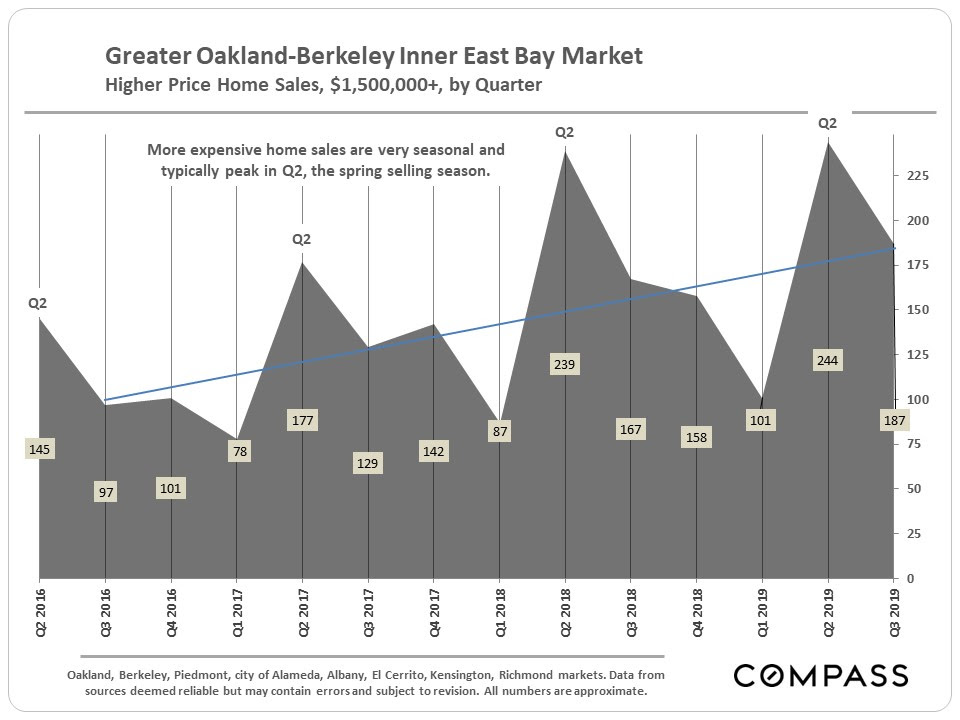
Higher-Price Home Sales
The market for more expensive homes in the region has remained particularly strong, with Q3 2019 sales volume well above that of Q3 2018.
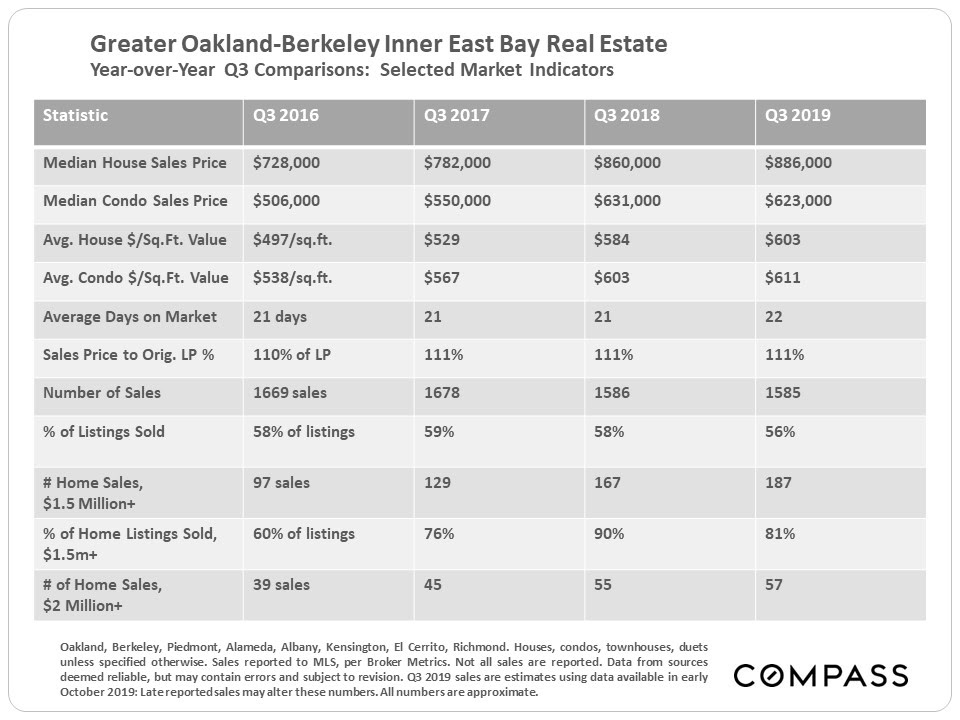
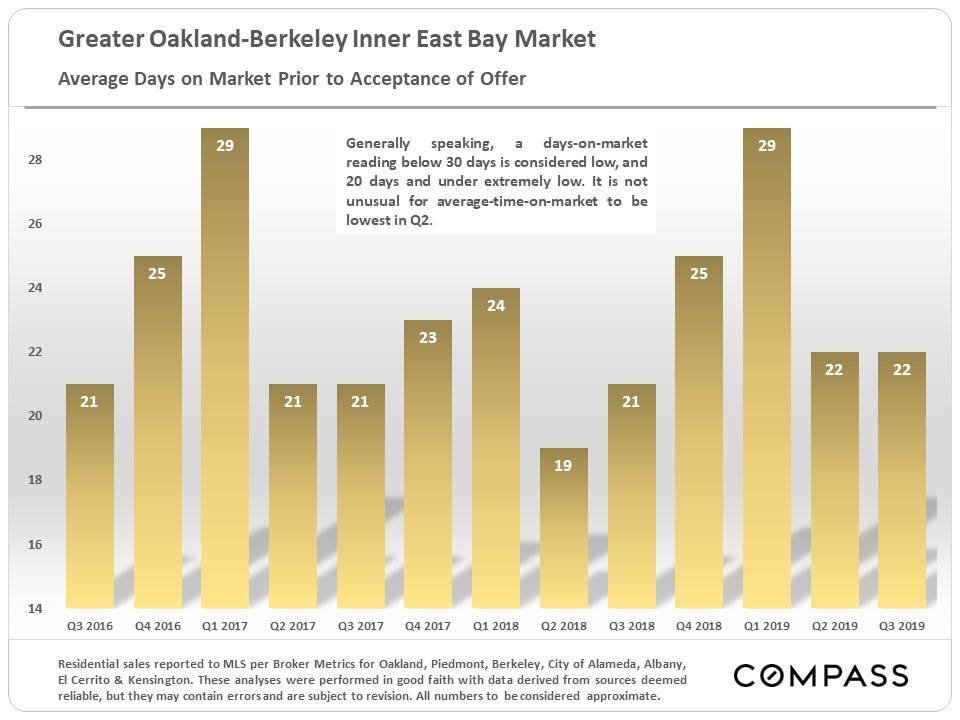
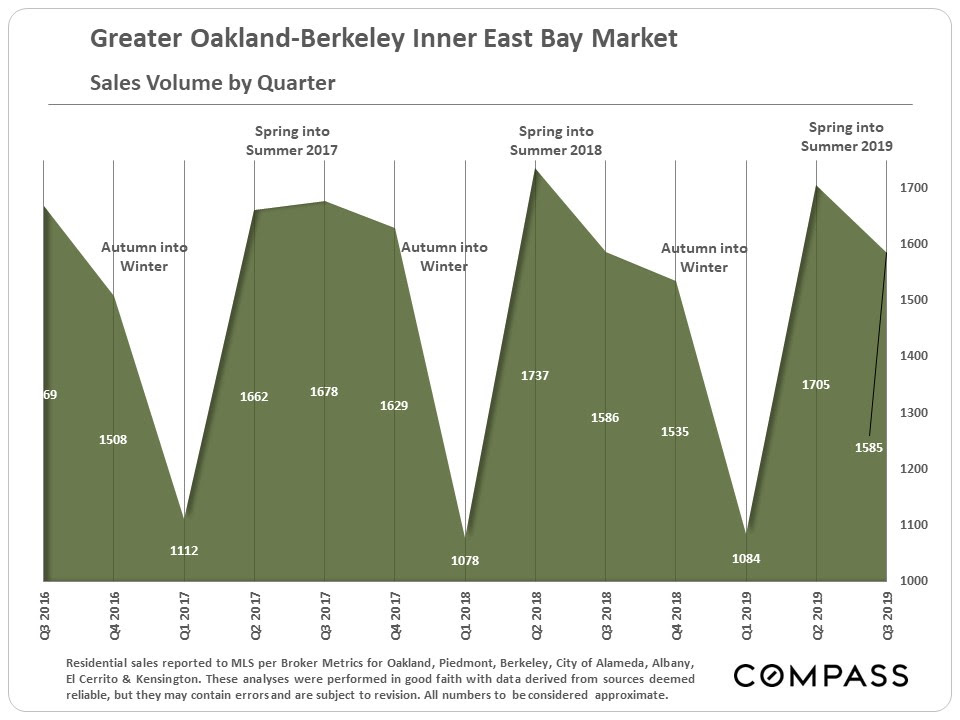
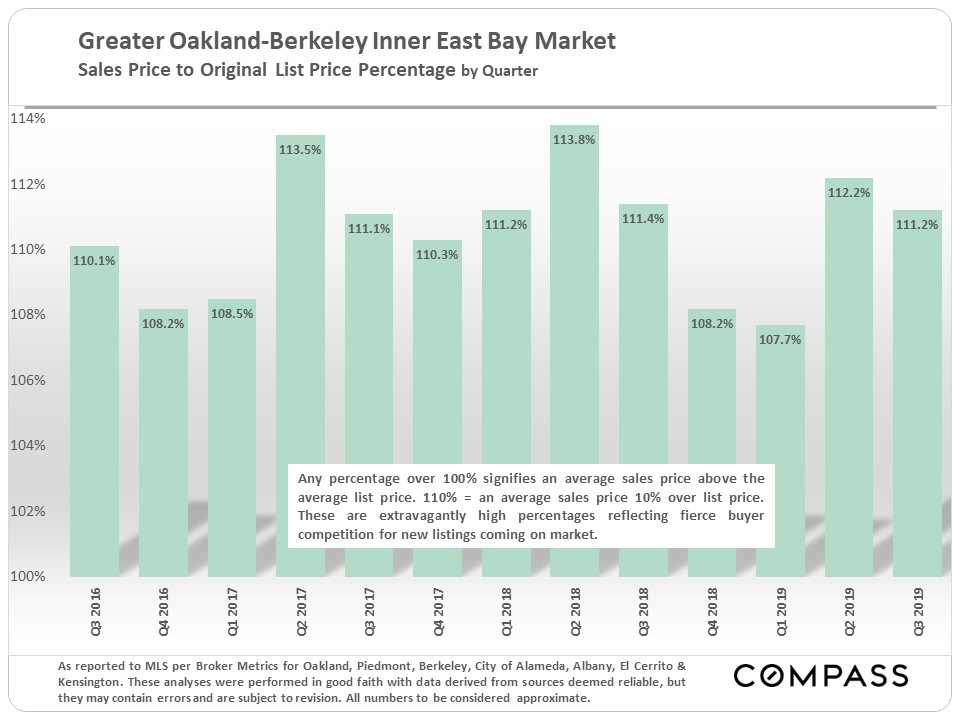
Selected Market Indicators
The statistics illustrated in the next 3 charts all reflect continued high buyer demand: Very low average days-on-market figures, sales volume holding up well year to year, and extremely high average overbidding percentages.
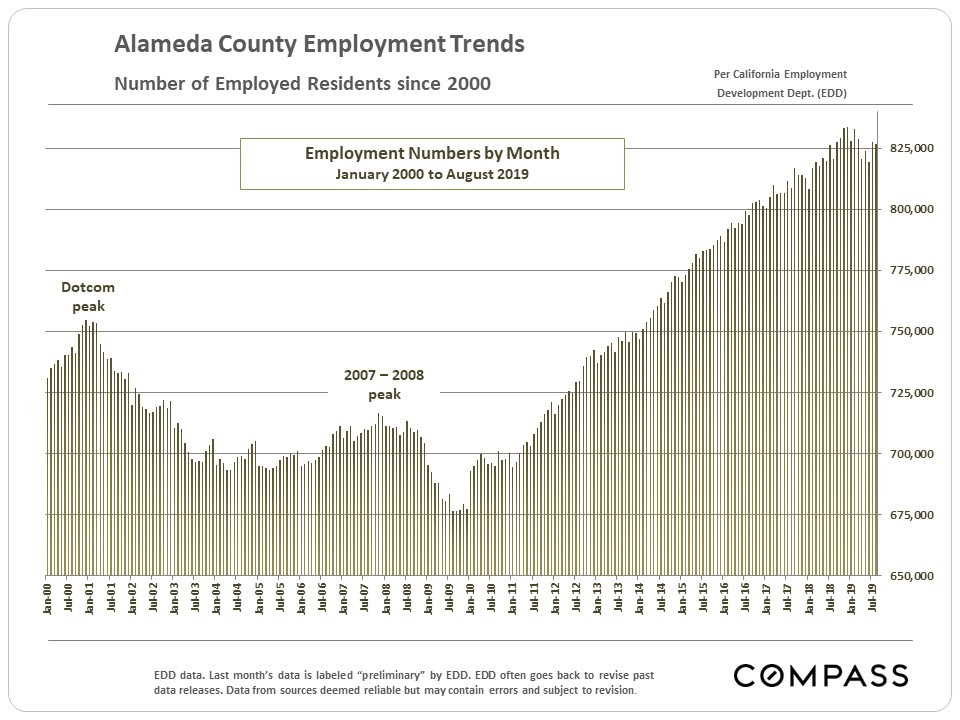
Employment Trends since 2000
Behind the story of home price appreciation since 2000 are the ups and down in the number of employed residents. After a spectacular boom in job creation since 2010 – many of the new jobs quite well paid – the number has dropped a little in the past year (according to the CA Employment Development Department). That still qualifies as short-term data and does not necessarily indicate the beginning of a trend.
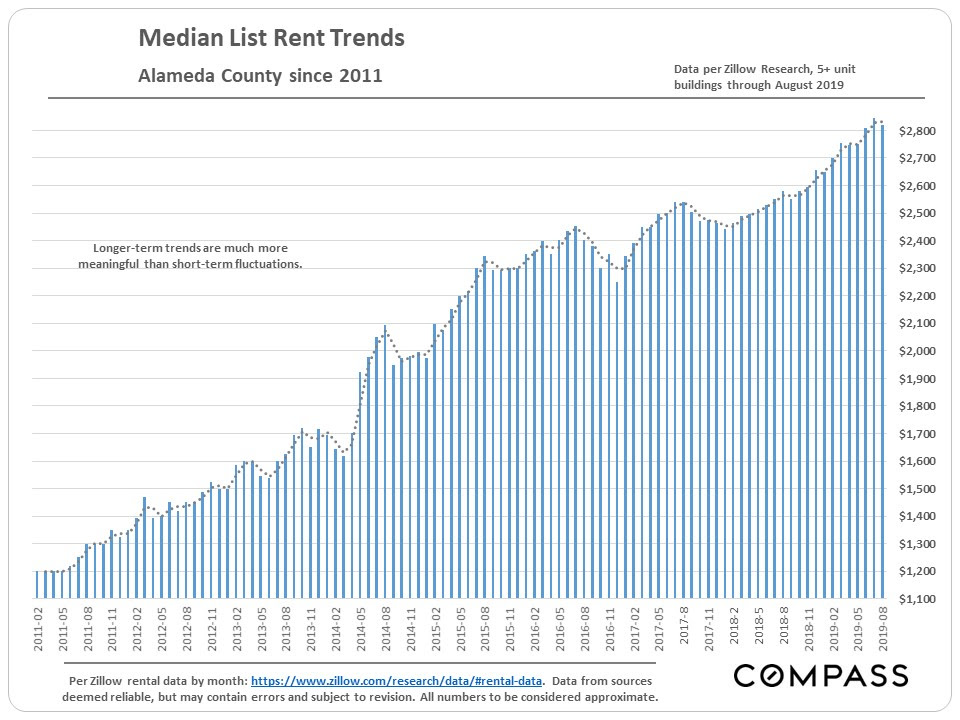
County Rent Trends
Housing affordability, rents and rent control have been much in the news. Illustrated below is the dramatic increase in market rent rates since 2012. Economists believe there should be generally parallel trends in rents and home prices, those being the 2 housing options (besides living with one’s parents).
Mortgage Interest Rates
A year ago, many experts predicted that interest rates in 2019 would average in the 5.5% range, but they plummeted instead, a major dynamic in this year’s market. Historically, it has been very difficult to predict interest rate movements.
