With April’s end, we now have 2 months of spring season data unaffected by market activity at the end of 2018, when financial markets plunged. By early May 2019, stock markets had recovered to hit new highs (though there has been some subsequent volatility), interest rates are far lower than last year’s peak, and local unicorn IPOs have begun to roll out after a media frenzy of speculation regarding their potential effects on real estate markets.
The greater Oakland-Berkeley area market remains the strongest in the Bay Area. Many local counties have seen significant softening in their supply and demand dynamics, sometimes accompanied by year-over-year declines in median home sales prices. So far, this has not happened here: Its relative affordability compared to SF, San Mateo and Santa Clara Counties is certainly a major factor.
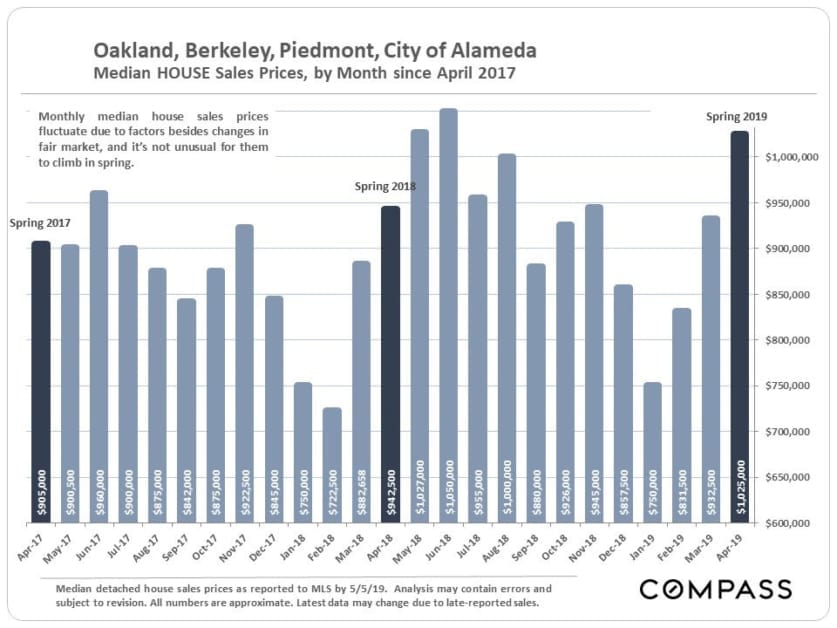
Monthly Median House Sales Prices – 2 Years
This first chart looks at the combined median house sales price for the 4-city region. No single month’s median price should be regarded as a definitive indicator of market conditions, and 2 more months of spring sales data are yet to come before summer, when the market usually slows.
In 2018, median house sales prices continued to increase to hit an all-time peak in June. Comparing year-over-year Q2 – April through June – statistics will be a major indicator of market trends.
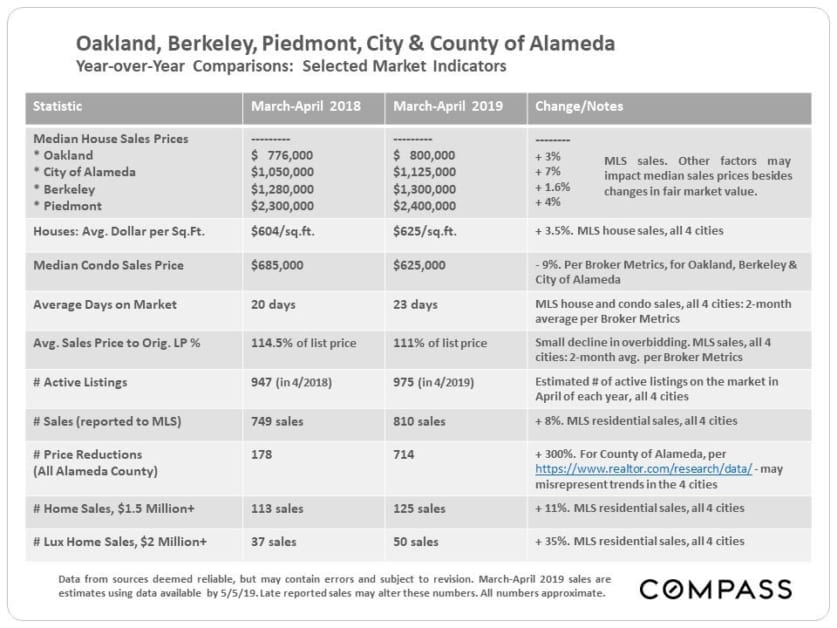
This table compares the March-April market statistics of 2018 and 2019. Individual city median house sales prices have ticked up, and sales have increased, both in the overall market and in higher price segments. The huge jump in Alameda County price reductions delineated below is likely concentrated in cities closer to Santa Clara County (which has seen considerable cooling in its market since last summer).
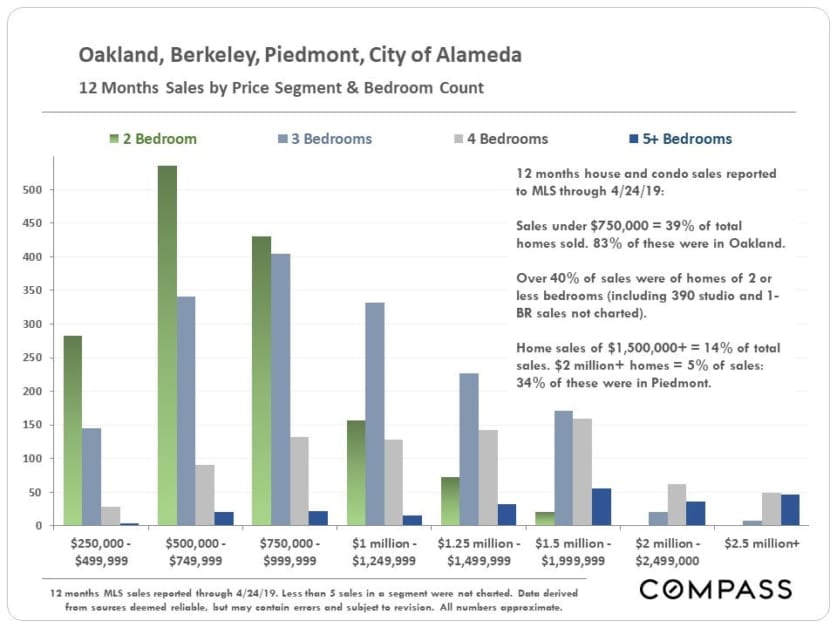
Home Sales by Price Segment & Bedroom Count
An illustration of the last 12 months of house and condo sales broken out by price range and number of bedrooms. These sales are spread among a large number of very different markets within the 4-city area covered by this report.
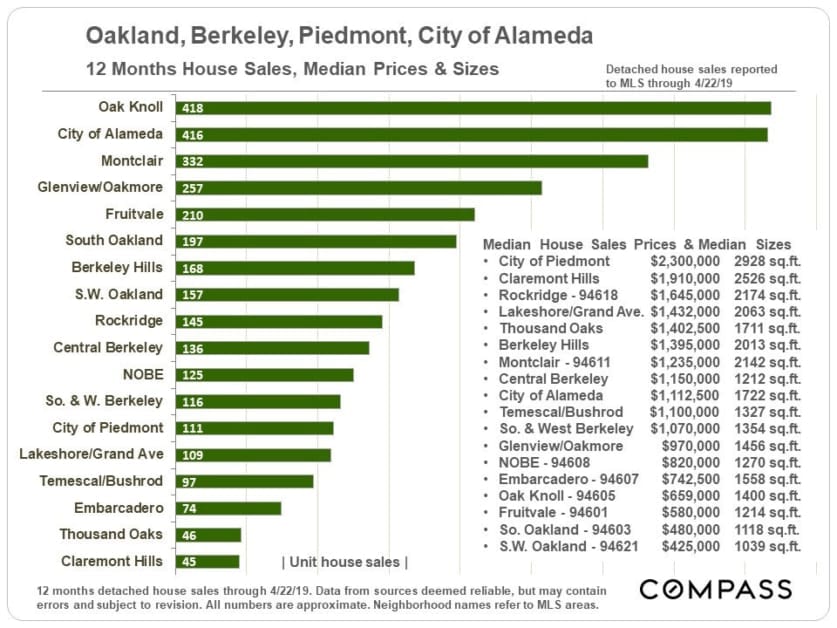
House Sales Volumes, Median Prices & Sizes
The next chart breaks out the number of house sales over the past 12 months by city or sub-market, with median house sales prices and median square footage. (Median means half the sales were for more, or larger size, and half for less, or smaller size.) Note that the Oakland and Berkeley neighborhoods listed represent larger MLS areas or zip codes.
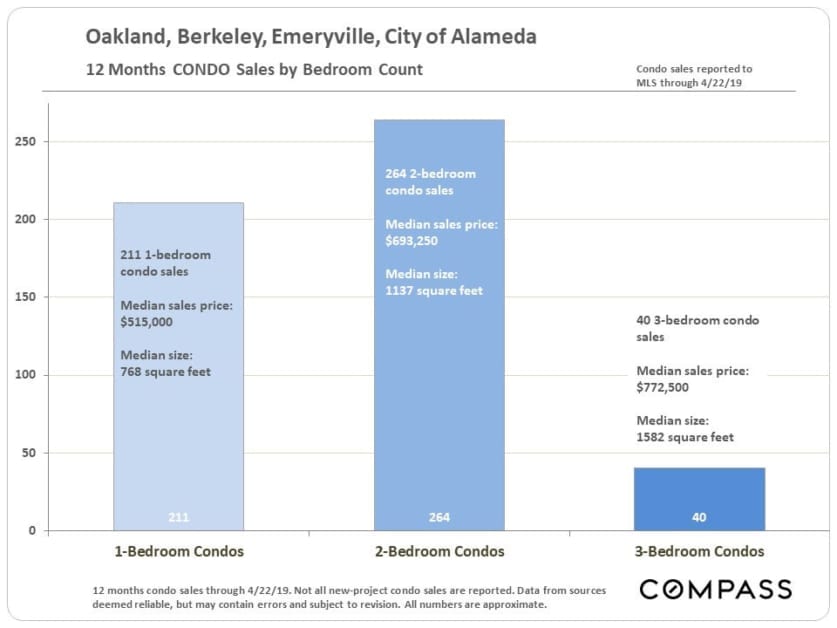
Condo Sales Volumes, Median Prices & Sizes
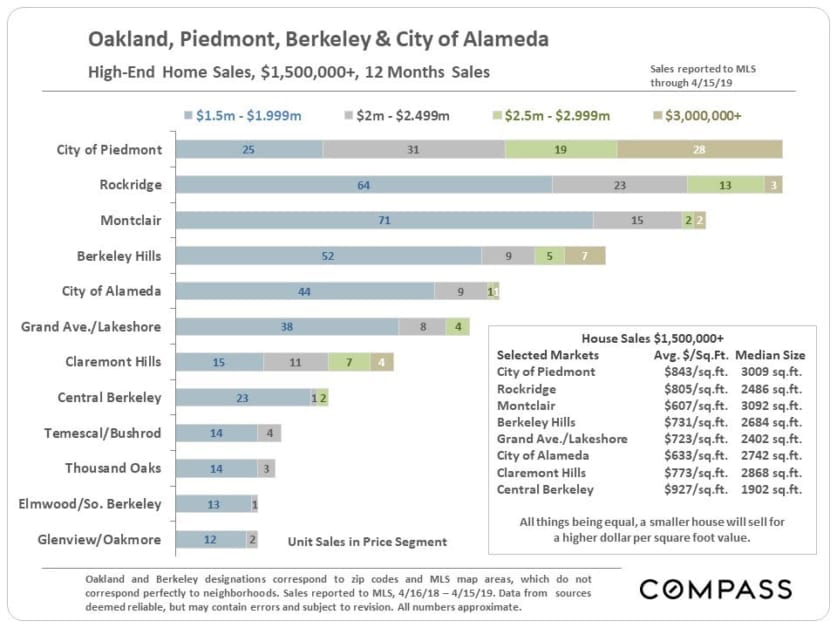
Higher-Price Home Sales, $1.5 Million+
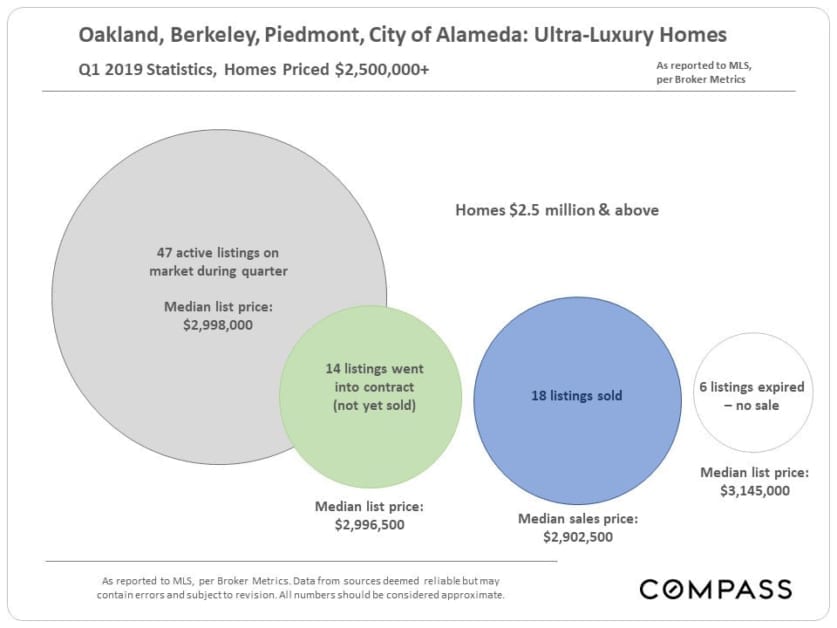
Q1 2019 Highest-Priced Homes Market
The highest priced home segments of most Bay Area markets – which start at varying price thresholds – are significantly weaker than that market segment here.
Q2 is typically the most active quarter of the year for luxury home sales.
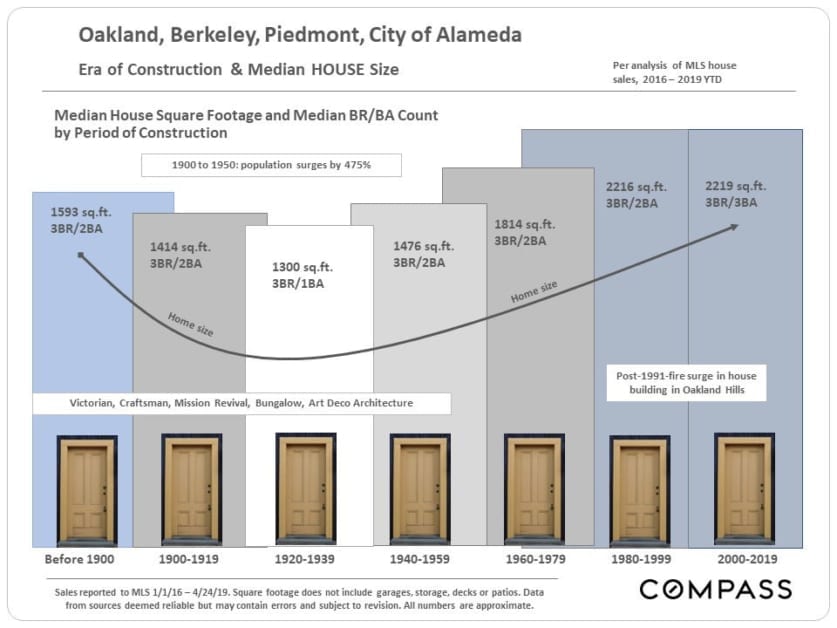
Home Size & Era of Construction
Many factors influence home construction size during any particular period: Affluence, economic conditions, household size, buyer age, land costs, population growth, natural disasters, bridge construction, etc. Generally speaking, the median sizes of houses built in the Victorian and Edwardian eras were somewhat larger than those constructed in the 1920’s and 1930’s. From 1940 on – after the completion of the Bay Bridge in 1936 – they began increasing again until reaching the current median size of just over 2200 square feet.
The figures below are based on recent home sales, and over the intervening decades since original construction, adding a second bathroom and/or a third bedroom behind the garage to older homes were popular renovations.
Over the past few decades, condos have become a major alternative for people purchasing homes of smaller size.
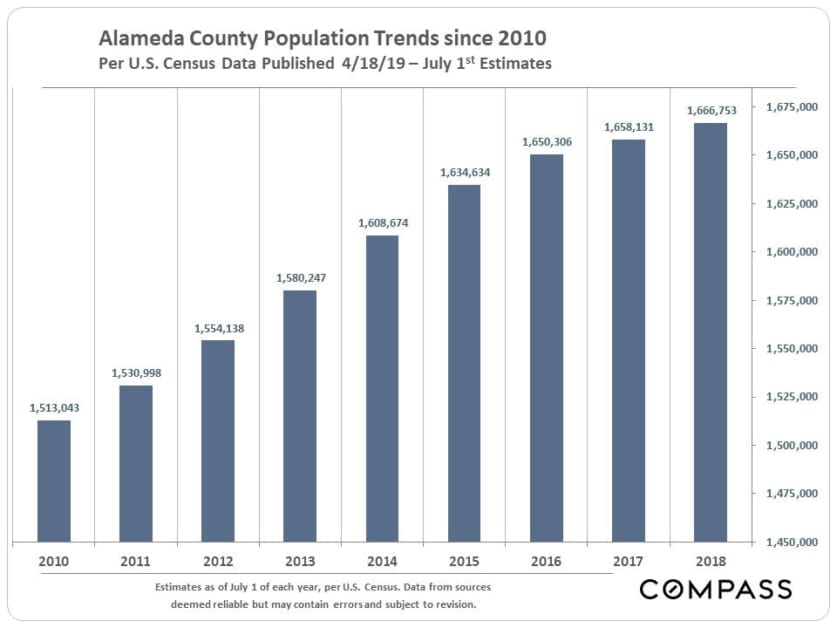
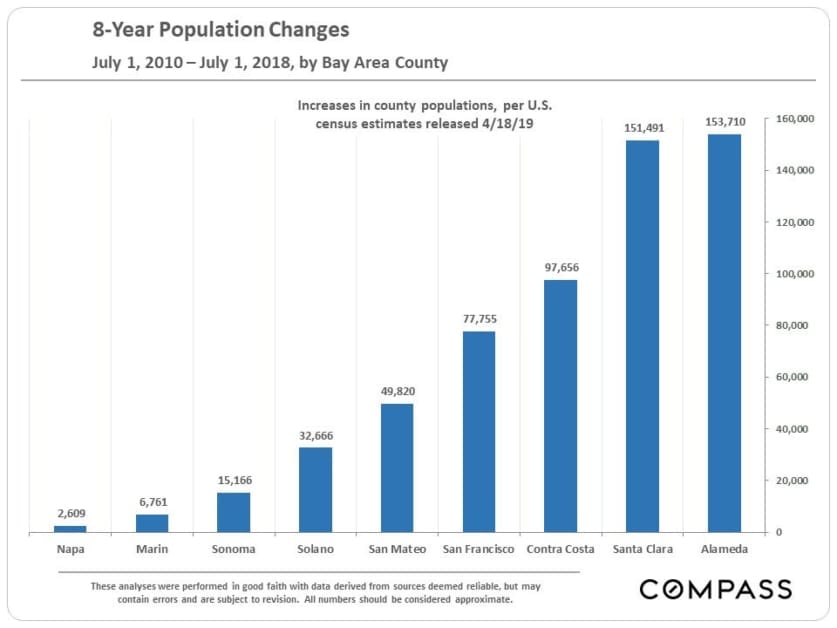
Selected Demographic & Economic Factors Population Growth
Increases in population obviously play a large role in housing markets, as they pressurize demand. Alameda County is not the most populous county in the Bay Area – that is Santa Clara County – but, since 2010, it has seen the highest growth rates by number and percentage increase (10.4%) in residents. For the latest 12-month period measured by the census, through July 1, 2018, its increase in residents has far outstripped other Bay Area counties, i.e. Alameda continues to be a big destination for those relocating to or within the region.
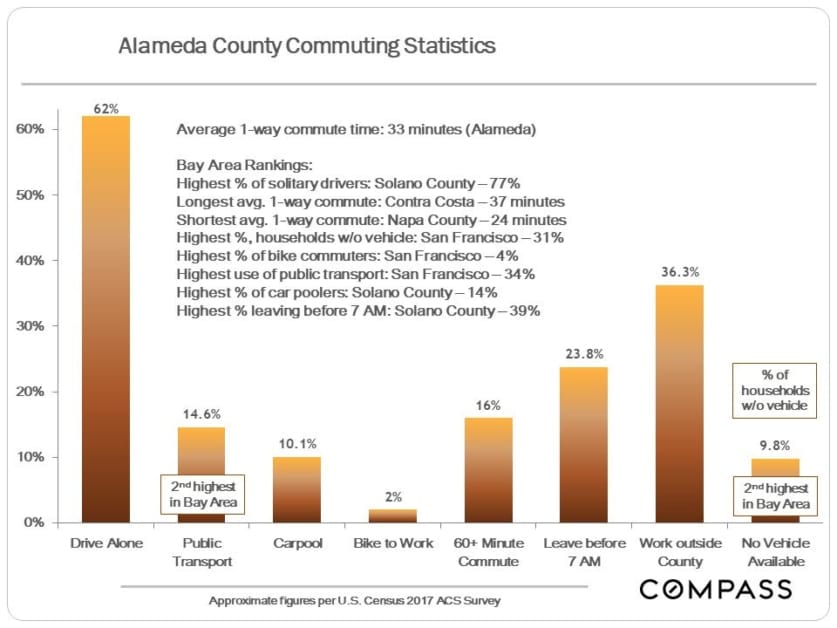
Commuting
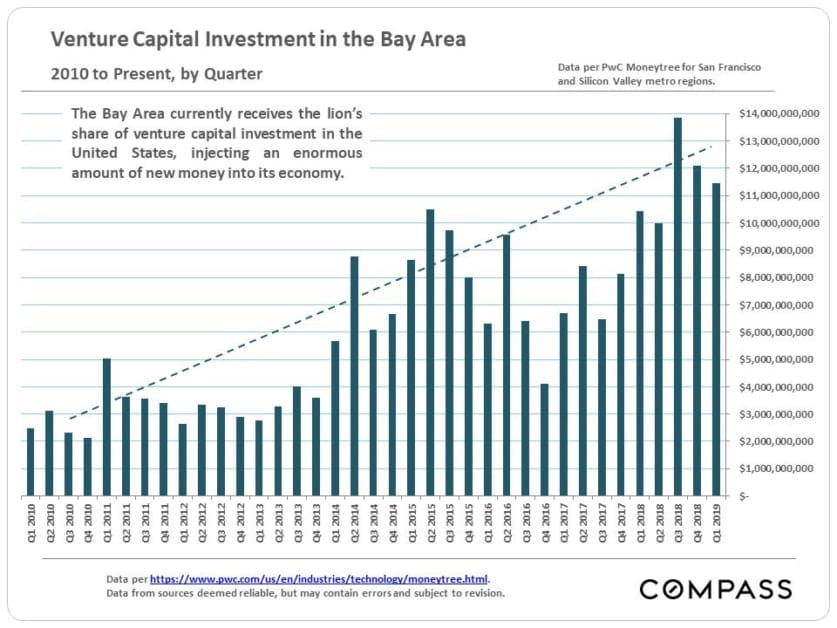
Venture Capital Investment
In recent years, the Bay Area has been the biggest destination of venture capital investment dollars in the country – and probably the world. These tens of billions of dollars have constituted a massive factor in the local economy, supercharging the creation of new companies, hiring, and, eventually, IPOs. Ultimately, venture capital is seed money that in the last decade has exploded into the creation of stupendous amounts of new wealth.